In Minnesota, black-legged ticks have expanded their territory since 2007. More people live in wooded areas where ticks thrive, more mice and other rodents that carry Lyme disease survive warmer winters, and more ticks "hitchhike" on birds and humans.Then follows some statistics about tick-borne disease (including the nasty "Lyme disease"), and the increasing prevalence of ticks in Minnesota, which I don't dispute. However, at the end we get a (second) quote from meteorologist Paul Douglas:
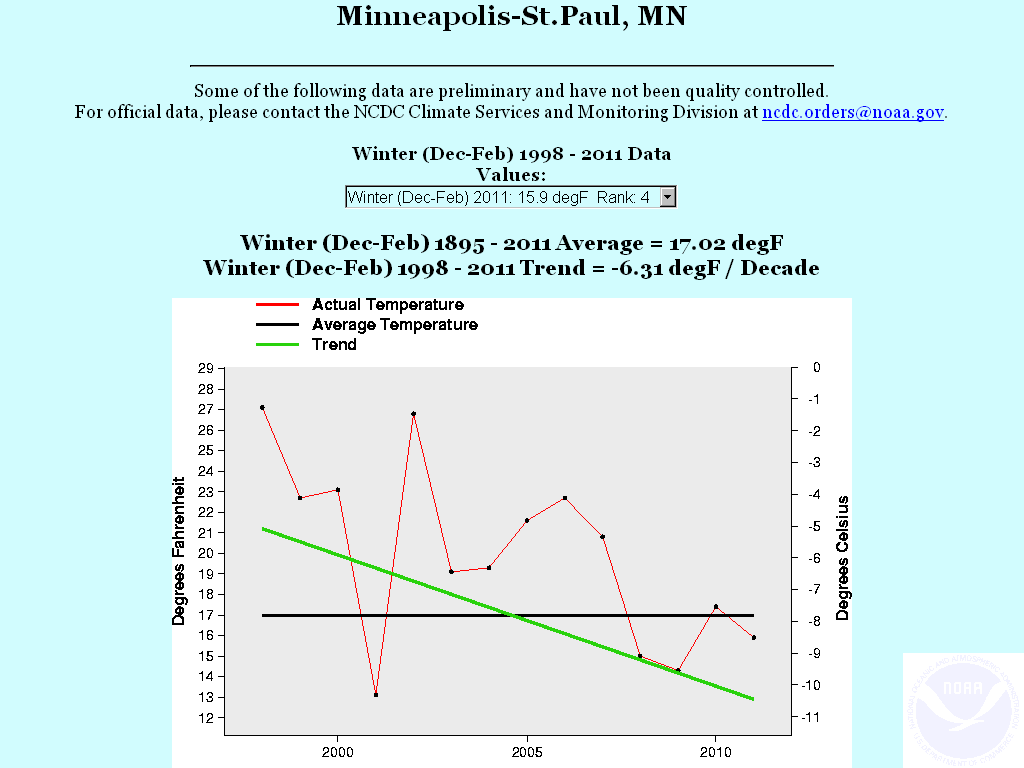
Winters in Minnesota have grown milder since 1998, Douglas said, with a steep reduction in Arctic air that was common even 20 or 30 years ago. "It's a slow-motion evolution," he said.That "grown milder since 1998" is precise and checkable so let's do it, starting with NOAA's National Climatic Data Center's data for Minnesota:
 |
| NCDC Winter temperatures for Minnesota, 1990-2011 |
Apart from a downward tick for 2001, average winter temperatures have declined since 1998 (the peak). There's even a statistical downward trend since 1990. Focus in on Minneapolis-St.Paul, 1998-2011:
 |
| NCDC Winter Temperatures for Minneapolis-St.Paul 1998-2011 |
Other cities and towns in Minnesota show a similar trend from 1990, with pronounced cooling since 1998. The NCDC chart shows a downward trend of -0.88°F (-0.49°C) per decade, a whopping 8.8°F (-4.9°C) per century, the Minneapolis-St.Paul data an almost incredible 63.1°F (35°C) per century.
Where has Mr. Douglas been the last two decades, particularly since 1998? More to the point, where does he get his data to support his comment? Who is this Paul Douglas? Wikipedia knows - it seems he's an (ex-) TV weatherman, columnist and blogger. The Wiki page soon reveals something rather relevant :
Douglas regularly writes and speaks about global warming and is critical of those who say that it is not occurring or is not caused by human actions.I write about global warming and I'm critical of those who say that something is occurring (warmer winters in Minnesota) when it's not. Mr. Douglas thinks Global Warming "deniers" are "immoral" ("Paul Douglas: 'I'm a recovering Republican, and I don't recognize my party any more"). I think those who tell the opposite of the truth are immoral.
As for Mr. Douglas' "steep reduction in Arctic air that was common even 20 or 30 years ago", have a look at "Arctic warming, increasing snow cover and widespread boreal winter cooling":
Abstract
The most up to date consensus from global climate models predicts warming in the Northern Hemisphere (NH) high latitudes to middle latitudes during boreal winter. However, recent trends in observed NH winter surface temperatures diverge from these projections. For the last two decades, large-scale cooling trends have existed instead across large stretches of eastern North America and northern Eurasia. We argue that this unforeseen trend is probably not due to internal variability alone. Instead, evidence suggests that summer and autumn warming trends are concurrent with increases in high-latitude moisture and an increase in Eurasian snow cover, which dynamically induces large-scale wintertime cooling. Understanding this counterintuitive response to radiative warming of the climate system has the potential for improving climate predictions at seasonal and longer timescales."For the last two decades" - I nearly ran out of fingers, but I'm pretty sure Mr. Douglas' 1998 is in there somewhere. Who's the "denier" now?
UPDATE 30th Jan. 2012
The Hufffington Post (such a goldmine of unbiased opinion!) says "On Climate Change, Weathercasters May Be Misguiding Their Viewers"
"If you look at the stats over the past five or six years, the public's belief that global warming is a serious problem, or is even happening, is declining," said Daniel Souweine, co-founder of the nonprofit Citizen Engagement Lab. In fact, nearly 40 percent of Americans are not convinced that the earth is heating up, according to the latest Pew Research Center poll.
"We think that's a result of the fact that they're not getting the right kind of information about what the science says," Souweine told The Huffington Post.We've proof that one, in particular, isn't giving the "right kind of information", as I've shown graphically.
UPDATE 6th Feb. 2011
I found I'd used a GISS dataset for an entirely different Minneapolis for my original chart (should've spotted the different lat/lon - silly me!), so to save time sorting THAT out I've substituted the NCDC plot for Minneapolis-St.Paul for the relevant 1998-2011 period.I've altered the text to suit - If anything it reinforces my point.
UPDATE 12th Feb. 2011
On his his Star Tribune blog is a "Send Paul a question" link, so I've done just that, and here it is:
A few weeks ago, you were quoted in a Star Tribune article on ticks in Minnesota:
"Winters in Minnesota have grown milder since 1998, Douglas said, with a steep reduction in Arctic air that was common even 20 or 30 years ago. "It's a slow-motion evolution," he said."
http://www.startribune.com/local/east/137802778.html
I'm interested in temperature trends, and often use the NCDC "Climate At A Glance" page to check trends for the US. However, using the form for Minnesota http://www.ncdc.noaa.gov/oa/climate/research/cag3/mn.html to plot winter temps since 1998 shows them to have been declining. I wonder if you could point me to a source that shows the opposite?I'll let you know if I get a response.


