Showing posts with label Nils-Axel Mörner. Show all posts

Monday, 18 February 2013

What's the Heartland Institute up to now?

A while ago we had Nils-Axel Mörner and Willy Soon making fools of themselves, claiming that crowds viewing horse-jumping on Atlantic City's Steel Pier had caused temporary subsidence of the pier, and therefore its tide-gauge, easily refuted by reference to other gauges along the north-east coast, which show similar variations. They were trying to show that tide-gauge sites are always unstable, by attempting to show that just one of the 2,000 or more sites worldwide might be unstable. For some reason unknown to me, the Heartland institute thinks that Mörner has something useful to say on sea-levels worldwide. Debunking his outrageous, always changing, and unscientific claims is easier than showing that Bill McKibben can't "do the math". I excoriate Mörner here, here. here, and here.

Now we have James H. Rust, who's
a policy advisor for The Heartland Institute, a retired professor of nuclear engineering, and an outspoken critic of unnecessary alarmism over man-made global warming. He funds several scholarships for students majoring in chemical engineering at Purdue University. He currently is delivering a talk titled “America's Failed Energy Policies and The Reason Why.”
.... suggesting that NOAA has "something to explain" about his straw-measurement of sea-level at Fort Jefferson, Florida. What's a "straw-measurement"? It's like a "straw poll" - rough and ready, and you can't get much rougher than a brick, which is how James does his measuring.
Fort Jefferson in the Dry Tortugas of Florida has an ocean-fed moat that surrounds the large fortress constructed from 1846 to 1875 and never finished. At the single entrance to the fort on its Southern side is an entrance surrounded by a border of marble. Around this border is a brick facade. Sea level height and changes can be measured by the number of bricks above the ocean water line beneath the marble border at the bottom of the entrance.
At 2:30 p.m. February 2, 2013, seven bricks were exposed beneath the fort entrance. These bricks appeared dry and this gave reason to believe the observation was made at high tide. Checking tide data for the Dry Tortugas confirmed 2:20 p.m. was high tide for February 2, 2013.
Checking books in the Fort Jefferson bookstore produced a picture of the fort entrance taken in January 1937. This picture showed all dry bricks above the water line and indicated about 7 and 3/4 bricks were above the water line. A brick and one layer of mortar has a height of about 85 mm and it was estimated the change in Gulf of Mexico water level for the 75-year period was 75 mm. This indicates an annual change in water level at Fort Jefferson of 1 mm per year.
Really? A change in the entire Gulf of Mexico water level estimated from a single observation on one day in 1937 compared with another made at high-tide on one day in 2013, and at a single location? Would temperature measurements made at those two moments be able to tell us whether the temperature there was rising, falling, or remaining much the same over that period? Of course not, whatever the trend, that trend doesn't predict what will occur, or indicate what had occurred, on any particular day. He continues
It may be argued the 1937 picture was not been taken at high tide. If this is true, then the change in sea level would have been less than 1 mm per year. It may be argued the fort is sinking due to its extreme weight. If this is occurring, the sea level rise would be smaller than 1 mm per year.
The National Oceanographic and Atmospheric Association (NOAA) has a map of the world showing sea level changes at hundreds of locations around the world.
The closet [sic] NOAA sea level change data near Fort Jefferson is for Key West, Florida and Cabo San Antonio, Cuba. Both locations are about 70 miles from Fort Jefferson. For the period 1913-2012, Key West has a sea level rise of 2.24 mm per year. For the period 1971-2009, Cabo San Antonio has a sea level rise of 3.30 mm per year.
Sea level rises in both locations reported by NOAA data are considerably greater than rough measurements made at Fort Jefferson. It is left for NOAA to explain this discrepancy on sea level rise for locations so close to each other.
It's not for NOAA to explain anything, as we'll see, and here's a tip from me - don't ever accept an invitation to go sailing in the Gulf with the prof. My Google Maps tracing tool shows Fort Jefferson to be 225 miles NW of Cabo San Antonio, which is the extreme westernmost point on Cuba. His geographical knowledge might be said to be somewhat lacking, in common with Nils-Axel Mörner, as I'll show in a later post (v. soon). Not that geographical knowledge is a real issue here, but a sense of (scientific) direction is.

A little knowledge is a dangerous thing, it's often said, and James has even less than that on this subject. He might have been an excellent professor of nuclear engineering, and he might be "an outspoken critic of unnecessary alarmism over man-made global warming", as I am, but he knows jack sh**, well, you know, about the tides or sea-level in general., and in the Gulf of Mexico in particular. Let's educate him a little.

There are two high tides a day (more accurately every 24h 25.2m), in this part of the Gulf of Mexico, and they follow what is, apparently unbeknown to James, the lunar tidal cycle, dominated by the gravitational pull of the Moon, modulated by that of the Sun. Not all places worldwide have two tides a day; some have only one, and some have two tides during part of the cycle, and one for the remainder. In a few areas, like the central Baltic, there are no tides whatsoever.

NOAA, who he says has "something to explain", has convenient tide data pages for their gauge sites. Here's the one for Feb 2-3 2013 at Key West.

Water level for 2-3rd Feb 2013 at Key West, Florida                                 Source: NOAA
Note that the actual tide was a little over 6" or about 16cm above that predicted. Brick-centric observations by James indicate that there was a rise of some 7.5cm over the 76-year period (2013-1937 = 76, not 75). That means of course, that had the tide followed orders, the 2013 level would have been less than the 1937 picture showed. How so? Is the sea-level here, and at Key West, an excellent proxy, not rising? Indeed it is, as the NOAA plot (thoughtfully not provided in the blog post for our edification) shows
Key West, Florida 1913-2012                                                                     Source:NOAA
This gives the impression that It's not possible for any average monthly level in 2013 to be less than that in 1937, but that's because this chart has had the "average seasonal cycle" removed (top left). It's not raw data, and it's done to make the overall picture clearer. Here's the raw plot

Key West, Florida 1913-2011                                                                Data source: PSMSL
Now it's obvious that many months in the middle-thirties had higher averages than many months in the entire period since. Here's how the data for February varied. I've highlighted Feb. 1937.

Key West, Florida; February average 1913-2011                                Data source: PSMSL
January 1937 was lower at 7055mm, but that's still higher than many months since, January 2009 for example at 7029 mm.

Here's a NOAA plot from 2nd Feb to yesterday, 17th Feb.

Water level for 2nd-17th Feb 2013 at Key West, Florida                            Source :NOAA
It should be clear by now that any single observation is just that, even when compared with another single observation, whether measured in metres, feet and inches or bricks. Rusts's post was titled "A New Sea Level Rise Data Point: Not Too Serious", and it's just that, a data point, but it reveals he's missing the point. He's right - it isn't too serious, but he's not right because of any observations or deductions he's made. He's right because the trend of sea-level rise at Key West, which he's unaware of, but which I already had in my spreadsheet for Key West (as in most others I maintain) shows this

Key West: trend in mm/year from 1913 to year on lower axis           Data source: PSMSL
..... that there's been no change in trend over the last four decades. Also, GPS at Key West Naval Air Station shows that the site is subsiding at about 0.63 mm/year, which means that true sea-level there is rising at about 1.5 mm/year. Subsiding due to crowds flocking to see the 'planes take off and land, maybe? Heavier modern 'planes? The fact that this area of the Gulf eastward including Florida is subsiding? Need any more hints?

I'm "an outspoken critic of unnecessary alarmism over man-made global warming" too, but I make observations on what I know something about, and when I see an erroneous or unscientific analysis or conclusion by anyone I'll make it my business to point out any flaws. Sea-level at any spot is modified by rate of change, wind direction, barometric pressure, and sea temperature. Conclusions by retired professors of nuclear engineering on topics outside their sphere of expertise are clearly modified by preconceived notions, and a total lack of knowledge of what they're writing about.

Tuesday, 12 February 2013

Nils-Axel Mörner and his Cuxhaven Curve

In a previous post, I closely examined Nils-Axel Mörner's claims about sea-level in the North Sea, highlighting his "curve" which was based on a flawed "modelling" of the record for Cuxhaven on the North Sea coast of Germany,  I posed a question about satellite altimetry; "Does anyone really think that altimetry maps would be produced that could be easily refuted by data from a few tide gauges?". I now pose another; why would anyone produce a curve purported to represent North Sea sea-level changes over more than a century and a half, when reference to tide gauge records, even that for the single station used would prove it to be totally incorrect over its latter half? A certain Stockholm professor (retired) would. A certain Stockholm professor (retired) has.  Here's his curve again:

The Cuxhaven Curve, with a guest appearance by Amsterdam (d. 1930, R.I.P.)

It doesn't show "eustatic sea level". The term "eustatic" refers to a global change in ocean volume. The North Sea is not global, and Cuxhaven, used to produce the curve, ain't the North Sea. The abstract of his 1973 paper Eustatic changes during the last 300 years, which immediately contradicted the title (my bold), states
Tide gauges in rising and subsiding areas show a major change in the shore-level displacement at about A.D. 1840, caused by the onset of a rapid eustatic rise. Comparisons between information from Amsterdam, Stockholm and Warnemünde provide material for the reconstruction of the eustatic changes during the last 290 years. Relative uplift data from the Swedish west coast, corrected according to the eustatic curve established here, give the same location of the isostatic zero isobase as does the geological material for the last 7,000 years. The eustatic changes closely follow climatic changes. A rapid eustatic rise started about 1840, slowed down about 1930 and ended about 1950. Knowing the eustatic factor, the isostatic (or tectonic) factor is calculated for different areas of importance in the discussion of Holocene eustatic sea-level changes.
It's impossible to determine eustatic changes from a few tide-gauges and over a relatively small region. There's no way to separate the eustatic component from the local true sea-level change. Just to establish that local or regional rate, data from a number of gauges is needed and over the entire area of study. A couple in the Baltic and one truncated series on the North sea coast just ain't gonna cut it, but the "world's leading sea-level expert" has convinced himself he can.

 Warnemünde? It's in the southern Baltic on the German north coast. How does its record bear out the statement " A rapid eustatic rise started about 1840, slowed down about 1930 and ended about 1950"?

Warnemünde 2, GER 1855-2011                                                            Data Source: PSMSL

There's a little downward dip from 1930 to 1942 then it's "onward and upward", business as usual, and no sign of "ended about 1950". If Mörner had stuck to his previous theme of "No alarming sea-level rise", which I agree with, I'd have simply ignored his flawed methodology, blatant cherry-picking, gross over-simplification and misrepresentation. I'd have ignored him altogether. He'd have been singing the right song, and despite singing the wrong notes in the wrong order, and some very dubious words, it still would have been the right song. However I can't stand aside and ignore what is clearly a fabrication.

What about Stockholm, which I'm sure has a famous university, which must have produced many notable alumni? The situation there isn't clear cut at first.

Stockholm, SWE 1889-2011                                                                   Data source: PSMSL
Stockholm, and the gauge site along with it of course, is uplifting (post-glacial rebound) at almost 5 mm/year. However, GPS stations abound in Europe, and Scandinavia particularly. That for Stockholm shows 4.9 mm/year uplift (see chart below), and it's an easy matter to adjust the record upward by that amount.
Fig. 3 Interpolated surface of crustal uplift rates (in mm/y) according to BIFROST permanent GPS network data (Lidberg et al. 2007). From Postglacial rebound and relative sea level changes in the Baltic Sea since the Litorina transgression, Rosentau et al., BALTICA Volume 25 Number 2 December 2012 : 113–120
Stockholm has the "4.9" figure against it, second purple circle along the transect line from A at the bottom left (click to enlarge, as with all images which show that message on mouseover). Here's the annual average plot.

Stockholm, SWE 1889-2011, adjusted up by 4.9 mm/year                  Data source: PSMSL
This doesn't follow the Mörner model either. There's a big dip 1926-1948, then a slow decline (almost horizontal) to 1978, then an irregular upward trend to 2011. I could show the record prior to 1889, from the older gauges, but it's irrelevant here.

Gauges? There have been several; the first was a simple scale cut in the seaward wall of the Sluice, the sea-lock between the Baltic and lake Mälaren, marked in feet and inches (pre-metric, and Swedish feet). this was superseded by several wooden posts also marked in feet and inches, which had to occasionally be moved, vertically or laterally with construction work in progress, and replaced as they rotted. This shifting about created a veritable jigsaw puzzle for future researchers, who had to spot discontinuities in the records and consult ancient documents in order to create an (almost) continuous record up to the installation of a mareograph (float-gauge with pen recorder, similar to a barograph in operation) in 1889 at yet another site. That site is where the current (modern) gauge is located. (ref, The Changing Level of the Baltic Sea during 300 Years: A Clue to Understanding the Earth, Martin Ekman, 2009)

Mörner has said in several articles
Tide gauges were installed at harbor constructions to measure changes in tidal level and long-term sea-level changes. The Amsterdam tide gauge is the oldest, installed in 1682; the Stockholm tide gauge is the second-oldest, installed in 1724/1774; and the Liverpool tide gauge is the third-oldest, installed in 1768. Most tide gauges are installed on unstable harbor constructions or landing piers. Therefore, records from tide gauges are bound to exaggerate sea-level rise.
None of those statements is strictly true. In the 17th/18th centuries, no-one was worried about sea-level rise, indeed it was generally falling. Falling sea-level is a headache for port operators as it means expensive dredging may be necessary. Saying any tide-gauge is "the oldest" is rather like saying "my broom is 100 years old", when it's had 12 heads and 6 handles. The first Amsterdam tide gauge was the oldest; a simple wooden scale (in feet and inches, but Dutch feet!) it was superseded by several more as the Dutch built and improved canals and locks in and around Amsterdam and its port. I've outlined the history of the Stockholm gauges above. The Liverpool tide gauge was installed in 1991, preceded by a number of different types, and in different locations, the first being a wooden scale graduated in Imperial feet and inches. As Michael Caine would say "Not many people know that".

Most tide gauges were and still are are being installed on piers and jetties - it's where they're needed most, and they have to be installed over reasonably deep water where the lowest tide won't uncover the gauge. Anyone who thinks that these constructions are inherently unstable ought to consider that they were built to facilitate trade. No-one builds an expensive pier or jetty if poor construction would mean a costly interruption of that trade caused by equally costly extensive repairs or rebuilding. Records from tide-gauges are not "bound to exaggerate sea-level rise"; many do, but we've seen one example from Stockholm (do I know of someone who lives there?), and there are many more in the Baltic, Norway, northern UK, Canada, Alaska, China, Russia, and the Southern Ocean that show just the opposite, due to post-glacial rebound, and many more because of tectonic movement.

Mörner has to discredit satellite altimetry (despite having used it in several papers - will he withdraw them?), tide-gauges (but uses records without comment when it suits him), other scientists and their papers, and accepted and proven principles of steric (thermal, temperature-related) ocean expansion, because all of these refute his claims. Hence his silly stunt with Willy Soon, who should know better, claiming that horse-jumping, and the attendant crowds, had disturbed the Atlantic City pier and therefore the gauge installed there. Even if they were right, horse-jumping never caught on anywhere else in the world, and a 1904 storm that destroyed the seaward third of the massive "Steel Pier" left the gauge installation half-way along intact and virtually undisturbed. A claimed disturbance to one gauge out of almost 2,000 worldwide doth not an hypothesis prove, but one publicity-seeking stunt can reveal a lot about those who try it on.

That Washington Post piece was titled "SOON AND MORNER: Sea-level rise data based on shoddy science" and ends "Not surprisingly, objective sea level research should be based on observational facts in nature itself and not on computer models". Mörner considers other scientists who analyse sea-level data to be "modelling on the computers". I've shown he should have done a bit more of what he misleadingly calls "modelling" and "shoddy science" himself. By not doing so, he's making a fool of himself, and producing what is really "shoddy science"; not science at all in fact. Any scientist, and I count myself an amateur scientist as much as a blogger, should test their own hypothesis to destruction; look for evidence to disprove it as much, if not more, than evidence to support it. The "null hypothesis" should be a starting point. Mörner didn't look beyond a few gauges, and he didn't even look beyond 2000, calling that "current". He has an axe to grind, and the faithful should realise that he'll play any card, and from more than one deck, to grind it. He has shown no objectivity whatsoever - in anyone that's bad, in a scientist it's the road to advocacy and not the path of science.

I've had a NW Europe reference page in preparation for a while, and I'll get my act together and post it soon. It'll have rather more than a few charts for all countries bordering the Nort Sea and English channel, and several for the Baltic too.

Sunday, 10 February 2013

Nils-Axel Mörner - winner of the 2012 prize for science fiction

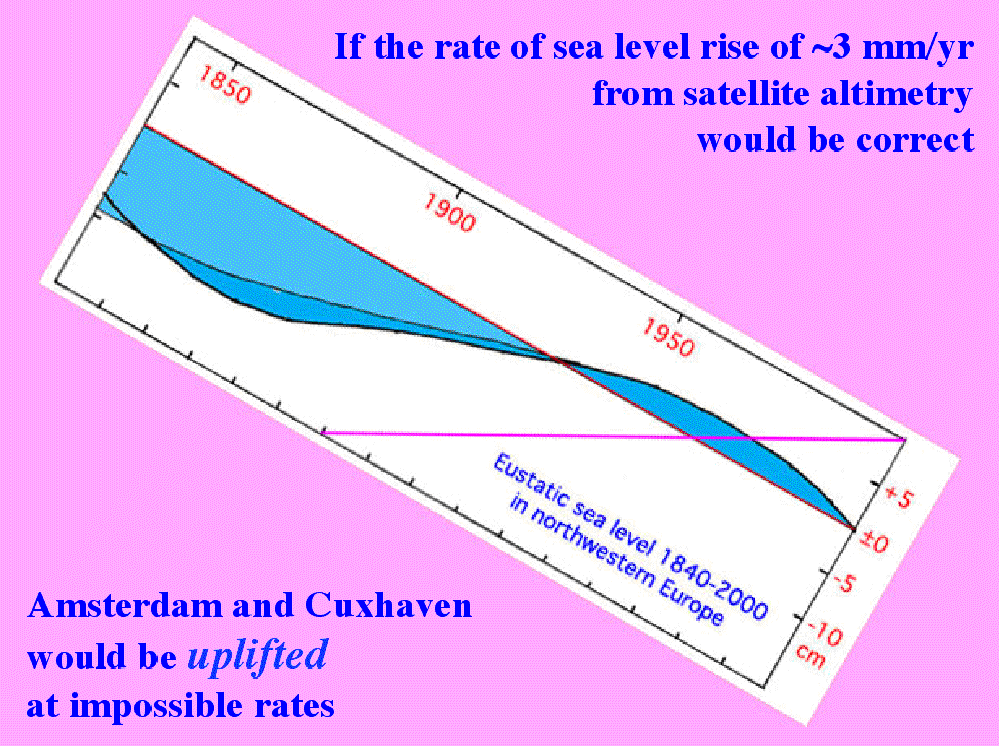
On 1st. December 2012, Nils-Axel Mörner showed the following slide (pdf at EIKE here) to attendees at a talk he gave (video here) during the seventh Heartland climate conference in Munich, entitled "Sea Level Rise - Fact and Fiction". Click to enlarge graphics.
Some of the "evidence" he produced, including this diagram, was fiction, and that which was not pure fiction was generally a misrepresentation of fact - not even the text on this slide is correct. He referred to it as "the current situation"; even those who are visually impaired can see it ends in 2000 - hardly "current" at the end of 2012. It's also a fiction because it doesn't include anything from Stockholm, as the text states, and as the following slide (below) shows; if it had it would be even more of a fiction, as Stockholm is pretty much in the middle of the Baltic, and far from the North Sea. It seems his geography is far from perfect, a failing he reveals elsewhere in his talk - a strange trait in a geologist.

"Amsterdam and Cuxhaven" - wot, no Stockholm?
I know that there were no satellites orbiting in 1840, apart from the moon of course. The satellite altimetry record started in October 1992, and applying a global rate to Cuxhaven is sleight of hand.

To be fair to Mörner, I think he allows himself to be totally seduced by his own views and controlled by his mindset, and so lacks objectivity. It's behaviour exhibited by conspiracy theorists, and Mörner demonstrates it clearly with his claims of "personal adjustments" of satellite altimetry. All adjustments are published on the 'net, and there are technical forums where they're discussed. The unadjusted data, and adjustment algorithms and relevant data are all available for public access. Does anyone really think that altimetry maps would be produced that could be easily refuted by data from a few tide gauges? From the many tide gauges that are in fact used to check their accuracy? Claims to have shown map inaccuracy invariably have a fatal flaw - they don't compare apples and apples; they don't compare identical periods from the maps and gauges. Comparing apples with apples is to compare the exact rate at the location with the gauge record over the exact same period. Those who seek to debunk the satellite maps are not just comparing apples with oranges, they're setting up a fruit market. More (much more) in a later post on this topic.

The "North Sea" slide may show the only sea-level "chart" you've seen that Mörner's produced himself. I've found no evidence whatever he's ever downloaded and charted a gauge dataset. It's clearly hand drawn, and the main curve is taken directly from his previous slide which represented Cuxhaven ("Coxhaven" on the slide), on the North Sea coast of Germany, the "German Bight".

Even this graphic contains a slight fiction - note the "2003" in the bottom RH corner; it's in a different font size, and there's no corresponding "tick mark" on the axis. That corner represents 2000, not 2003, as the distance to the previous tick mark shows, and the PSMSL annual chart for Cuxhaven confirms.
Cuxhaven 2 annual                                                                            Source:PSMSL
The 2000 tick mark at the top right is over what is the final broad spike on Mörner's graphic.

The red (subsidence rate) line is reproduced on the first slide as the zero line, which explains why it doesn't represent the mean, as is the convention with anomaly-type charts and diagrams. Both lines cross the polynomial curve at 1933, and this graphic shows that the curve diverges from the sea-level line after that point; it merely clips some of the spikes. Up to 1973 or so Mörner's plot matches the PSMSL plot very well; from then on it diverges suspiciously.

Cuxhaven annual (to 2010) adjusted down by 1.4 mm/year from 1844. Data source PSMSL
In "Sea Level is not rising" (SPPI), Mörner says he established the subsidence rate for the Cuxhaven gauge as 1.4 mm/year, so I've used it to adjust (downward) the annual plot for Cuxhaven. Published estimates for the subsidence rates along the Dutch and German coasts range from 0.6 to 0.9 mm/year. The chart is necessarily a little busy because I've added a polynomial curve (blue) to contrast with the curve in the first slide shown above; there's little similarity, and it's worth reproducing the diagram here for convenient comparison.
The text on the slide says "It fits the Earth's rotation (LOD) very well", but it doesn't represent any facts very well. Even if what is shown was true, it would say nothing of sea-level change elsewhere, not even in the North Sea. When land uplift or subsidence (from GPS monitoring stations) are taken into account, long-term North Sea sea-level change rates vary quite widely; some show an upturn in the last decade, some show a downturn, and some show no major variation in rate over the last few decades. Delfzijl is the next station to the west of Cuxhaven, and is just over the German border with Holland.

Delfzijl, Netherlands  Data source: PSMSL
It shows little similarity with the chart for Cuxhaven, shows little variation over the 20th century, and shows no slowdown after 1950.

Giving Mörner the benefit of the doubt, he's been seduced into believing that a polynomial curve supplied by someone else (see "Sea Level is not rising") reflects reality, and has based his sea-level "curve" on that. If he'd actually charted the record himself, with the most up-to-date data available, he couldn't have produced his curve. Data beats hypothesis hands down every time.

The previous slide to his "North Sea" curve (Cuxhaven curve, not quite the same thing) showed the PSMSL chart for Fremantle, Western Australia. Mörner never cites his sources for charts and diagrams and doesn't here; not a very polite nor ethical way of presenting such data.
Ignore that the title says 1897-2011 - it's 1897-2010. Ignore the "1893-2011" mean - Mörner's very bad with start and end dates, as we've seen earlier. Ignore his blatant "cherry-picking" of 1913-1956. Ignore that his "global eustasy" (absolute rise) was derived from just 2 1/2 gauge records in NW Europe (Amsterdam again!). Ignore that there's no source cited, he got it here, and I got the data for my Fremantle chart from the Australian BOM site.

This one's a real cracker though - Mörner commits what might be called evidential suicide. He's telling us that his absolute rate of 1.1 mm/year applies here, calculating a subsidence rate, then he's telling us that there was "little or no absolute sea level rise" which of course means that his rate of 1.1 mm/year doesn't apply here. It also shows no downturn after 2000. Nice one Prof.

I'll also tackle Mörner's famous (or infamous, depending on the point of view) Maldives paper later, which is flawed to the point of being worthless, but here's a taster from its third page (my bold)
The mean sea level seems closely to approximate the surface of a beach rock cut into a flat surface (a rock cut platform). The HTL is at + 0.45 m, the storm level at + 0.9–0.8 m, the sub-recent level is at + 1.2 m, and the old island surface at + 1.45 m. This seems to indicate that the island surface was built up at a 60 cm higher sea level and that the sub-recent level was formed at a 30 cm higher sea level.
A higher sea level of about + 60 cm in Late Holocene times is recorded in sandy environment (e.g. Hulhudhoo in the Baa Atoll) as well as in beach-rock environment (e.g. Fulhudhoo in the Guidhoo Atoll). The sub-recent level seems, in general, to have been at about + 30 cm (in sandy section of the Hulhodhoo as well as in the beach-rock coast of Fulhudhoo).
The most important and interesting fact is the sea level fall of about 20–30 cm between the sub-recent level and the present level. The morphology is clear.......
Beautiful logic chain here; seems.....seems....seems.....it's clear! I love that "seems closely to approximate" - how can something "closely approximate" something else? The language and logic "seems to closely approximate" that in IPCC AR4 "Summary for Policymakers", where a number of factors which are "likely" lead to a conclusion which is "very likely". How did he know what the "mean sea level" was, standing on a sandy beach with the waves lapping? All will be revealed in a later (but soon) post.

I'll also discuss his flawed methodology in general in a future post, along with examining more of his gaffes and sleight-of-hand. I thought (silly me!) that being sceptical meant demanding  "show me your evidence and your sources". Why has no-one on the sceptical side thought proper to actually examine his claimed evidence and his arguments in detail? Is he immune from such scrutiny? Is he to be believed no matter what he says? Is he infallible in some way, like the Pope? If the answer to any or all of these is yes, then his supporters are guilty of at best double standards and at worst religious adoration.

The audiences at his talks, and readers of his articles lap it all up. "Good old Prof" they chortle "He's sticking it to 'em!". "They" aren't impressed; "they" ignore and ridicule him alternately. He's sticking it to us, sceptics working to call into question shaky science and excoriate alarmists and alarmism. He's pissing into the wind trying to prove the unprovable, and it's sceptics in general getting the spray.

Wednesday, 23 January 2013

The Ups and Downs of Sea-level Recording

Google sometimes comes up with odd results - not the wrong results I hasten to add, but something unexpected, something novel, something revealing. Anyway, one result was a pdf which referred to Anthony Watts (Wattsupwiththat) as a "sea level expert", with a link to a WUWT post which contains the following:
IMHO The idea that a dock (or piling) is a long term stable measurement platform is simply ludicrous. Piles sink, structures decay, boats whack them, pounding wave action loosens their grip. One feature missing from all these old style tide gauges is any way to reference the long term level of the gauge itself. In the era of GPS we can start doing this, but in the years past, how much is from simple sinking of the pilings over time? When you are looking for millimeters per year, such things become significant.
Anthony Watts would hardly describe himself as a "sea level expert", but that's by-the-by. The post was discussing sea-level past and present in the Maldives, and curiously for such a topic, presented no sea-level data whatsoever. However it's Anthony's statement "One feature missing from all these old style tide gauges is any way to reference the long term level of the gauge itself" which I'm concerned with here. I could criticise him for that statement, written in ignorance, but I'll just ask the question "Can you think of any method of establishing the level of land surface, buildings, or anything attached to the land?". if you can't, go to the bottom of the class. If you thought "surveying" or it's more technical term "levelling" you go to the top. There is indeed a "way to reference the long term level of the gauge itself". Here's a photograph of a  surveyor engaged in that very process next to the Funafuti, Tuvalu SEAFRAME station in January, 2009:

Source: SOPAC
He's using a modern state-of-the-art instrument termed a "total station". The model he's using is one of the best. It can measure to 0.5 arc-seconds in elevation and traverse - that's 1/7200 of a degree, and to 1 in 1,000,000 in line-of-sight distance, which is 1 mm in 1000 metres. The latter is achieved using laser-ranging, also used to continuously monitor the height of the instrument above the benchmark below to 0.1 mm.

I can tell you the make, model and serial number of the instrument he's using (LEICA Total Station Model TCA1800, S/N 424936), his name (Andrick Lal) and the organisation he still works for - SOPAC (Applied Geosciences Division). He was there in 2009 with Nick Brown, a  surveyor for Geoscience Australia. The details of the survey (as for all others) are published in reports on the GA ftp server and many are referenced on the GA website.

They were actually establishing the exact location and height of the tide-gauge benchmark (TGBM) wrt to the benchmarks for the CGPS (continuous GPS) pillar which is located some 2.5 km away from the gauge, but Australia's National Tidal Centre surveyors use identical equipment and techniques every year or two - this is the only Tuvalu survey I've been able to find photos for. There's a chain of an additional 12 BMs between the tide-gauge BM and the CGPS pillar BM - 14 in all.
Levelling the Funafuti CGPS pillar:

Source: SOPAC
I read somewhere that these surveys always seem to take longer on the Pacific islands than elsewhere - I can't imagine why. can you?. BTW levelling doesn't involve any adjustment - it's a measuring exercise. Some claim that CGPS is used to "automatically adjust" gauges. Nothing could be further from the truth - those that make such claims generally include a diagram of a SEAFRAME station which shows the CGPS station firmly on land. Apart from that it's not practical to do so. Few are aware of the "crustal tide" caused by the Moon, which pulls the Earth's crust up and down, synchronised with the ocean tides. At the sites of the  Funafuti stations shown above, it amounts to around 10-20 cm at peak; any automatic adjustment would lower the gauge as the ocean tide rises, and vice versa.

The point I'm making is that this process is carried out regularly and with great care and the results made available on the 'net. Not all gauge sites worldwide are levelled as frequently as those in the South Pacific Sea Level Monitoring Programme however. Most aren't the focus of attention that these islands have become. Many are relatively stable and need less frequent checking. Note that even at other sites with CGPS stations on both the gauge and on land, regular levelling takes place. The benchmark which marks the datum (reference level) for measurements is referred to as TGZ - tide gauge zero. Sometimes the nearest benchmark is above lowest water and a fixed positive offset is added to the gauge readings to give an always-positive reading - from a "virtual benchmark" in fact.

Here's a picture (looking SE) of another gauge which is relevant to the secondary theme of this post. It's the Male-B station in the Maldives, northern Indian Ocean.The gauge, or rather gauges, are on Hulule island where the airport is situated, adjacent to Malé itself.

Source: SONEL

Source: University of Hawaii Sea Level Center
The people in the background on the right aren't back-packers but are part of a University of Hawaii team, on-site to check and maintain the equipment. Looks like a helluva job to me. I don't know how they can stand all that sunshine and sea air.
I include the following description because some people (no names, no pack drill) like to give the impression that sea-level data is recorded by a man with a marked stick and a clipboard, when he can be bothered so to do. The Malé station currently has three independent gauges; a float gauge with the small dome atop on the left, a bubbler gauge with the box on top, and a radar gauge on the black bracket over the water. The two large vertical "pipes" are "stilling wells". They aren't simply open at the bottom, but have holes near the lower ends which restrict the rapid influx or efflux of water (hence "stilling") to eliminate the effect of waves, the wash of a passing boat, or a diving horse, perhaps.

The potentiometer at the top of the float gauge. The toothed metal belt carries the float.
Looking down the float gauge stilling-well; the float is centre-right at the water surface.
Source (both photos): University of Hawaii Sea Level Center
A bubbler gauge releases nitrogen gas into the water near the bottom of the stilling well. At the depth of the release valve the pressure varies with the depth of the water above, and a pressure recorder monitors the pressure of the gas as it's released. Pressure varies linearly with depth so it's easy to convert the pressure readings into an accurate depth. A temperature sensor records water temperature so consequent changes in water density and gas pressure can be allowed for.

The workings of the float gauge, and the radar gauge over the water should be fairly obvious. The dome on the central pillar contains the receiver and aerial for the CGPS (continuous GPS) station which constantly records the E-W, N-S and vertical coordinates (position) of the station. Benchmarks at the station, and three sites around up to a kilometre away provide for levelling by surveying instruments. The station collects data and transmits it to a satellite at hourly intervals and it's been recording since 1990. There's another GPS (& laser telemetry) station located some distance to the NE which is part of the DORIS system, a worldwide network used for precise determination of the JASON-1 satellite's orbit. Here's what Male-B recorded between 1990 and 2010. Bear in mind that the CGPS station recorded some millimetre-sized ups-and-downs over the last decade but they averaged out to just -0.1 mm/year fall.

Data source: PSMSL
To the south, at Gan on Addu Atoll, is another float-type gauge, with a slightly longer record but which shows a similar 13-month profile and annual trend.

Data source: PSMSL
I've never seen these charts (or any earlier version from any source) shown on any sceptical blogs. Nils-Axel Mörner has written screeds on the Maldives, but I've never seen them shown therein either. Do they show something inconvenient? What, precisely, is wrong with the unvarnished truth? Mörner has referred to them however in a 2004 paper titled "New perspectives for the future of the Maldives". I don't know when he visited the Maldives, as rather curiously, the paper doesn't give any dates.  He states in his conclusion (multiple authors, but they're his words, I'm sure)
Tide gauge data have been cited in support of an on-going rise of mean sea level (Singh et al., 2001). Tide gauge records, however, do not provide simple and straight-forward measures of regional eustatic sea level. They are often (not to say usually) dominated by the effects of local compaction and local loading subsidence. With this perspective, our multiple mor-phological and sedimentological records appear more reliable and conclusive. Besides, satellite altimetry does not record any significant rise in global sea level in the last decades (Mörner, 2003a, Fig. 2). In order fully to investigate the situation, however, available tide gauge records, now extending from 1990 to 2002, were re-examined. This reveals a total absence of any rising secular trend (Mörner, 2003b).
He's saying that tide gauge records don't provide reliable indications of sea level trends, but uses them to prove a point he's making, because he claims that what they show conveniently proves that point? There's a word (several words in fact) for that kind of thing. It's also difficult to understand how 13 to 14-year-span gauge records could possibly reveal anything about the presence or absence of a "secular trend", as in this context "secular" means long-term. He also says "extending from 1990" - the Gan record starts in 1988. Incidentally, the reference "Mörner, 2003b" was never published. There's a whole story here but it's for a future post.

I take issue with his statement that "Tide gauge records, however, do not provide simple and straight-forward measures of regional eustatic sea level. They are often (not to say usually) dominated by the effects of local compaction and local loading subsidence". They are not so "dominated", but many are affected. Many others are affected by just the opposite, where the land is rising, and sea-level rise is understated, something he fails to mention here. His term "regional eustatic sea level" is confusing and ambiguous  It's a term he's proud to have invented - eustatic means worldwide or global so he's effectively using the term "regional global sea level". It's worse than confusing and ambiguous. It's meaningless, a contradiction in terms.

In my opinion, and in the opinion of others too, the worldwide tide-gauge network provides a more reliable source of environmental data than do thermometers in weather stations. Tide gauges have inherent sources of error, they're subject to vertical movement caused by subsidence or rebound of their mountings (piers, jetties, etc) and the land or seabed beneath, but those errors can be and are identified, quantified, and allowed for by adjustment of the data. What's more. such adjustments are usually very small and full details are published on the 'net. Many gauge stations have multiple gauges as at Malé, and an increasing number use CGPS to monitor stability and record the slightest movement. Most transmit their data at regular intervals by telephone line or satellite link, so any malfunction is soon spotted. All have a linear and uniform response, unlike temperature sensors whose non-linear response has to be allowed for by the recording circuitry, and they're not subject to sensor drift which may occur for some time before it's identified. There's no equivalent of UHI either, and so far no organisation has been able to get their grubby hands on the data and homogenise it or apply suspicious "adjustments".

Tuesday, 8 January 2013

The Nodal Tidal Cycle and a firm belief in the impossible

I've not paid much attention to the prognostications of Prof. Nils-Axel Mörner in the past, but recently his claims concerning global sea-level have been featured on several blogs, most notably Jo Nova. Several things struck me while reading the latter post, so I downloaded his paper entitled, rather uncompromisingly "Sea level is not rising" to give it a once-over. I focus here on this section with an accompanying chart:
French Guyana and Surinam
From this region, there is a very good tide-gauge record covering three 18.6-year tidal cycles (Fig. 14). The cycles vary symmetrically around a stable, horizontal zero-level. Satellite altimetry gives a rise of 3 mm/year in the same area. Facts and fiction seem to clash.
Figure 14. Changes in mean high-water level (cm: left axis) measured by tide gauges at the coast of French Guyana and Surinam (Gratiot et al., 2008; Mörner, 2010b). The record is dominated by the 18.6-year tidal cycle, which swings up and down around a long-term zero trend (the arrowed line), indicating that sea level has been quite stable over the last 50 years. However, satellite altimetry in the same region gives a rise of 3.0 mm/year – another revealing example of the difference between recorded facts and “reprocessed” satellite data.
I'll ignore for the moment that the graphic doesn't represent a tide-gauge record, that it doesn't show mean sea-level (which is what's under discussion here) and that it doesn't cover three tidal cycles. Instead I'll look first at what Gratiot et al., 2008 actually says about the nodal tidal cycle (henceforth NTC) and its manifestations and effects, and whether it affects mean sea-level (MSL) at all. The paper "Signifcant contribution of the 18.6 year tidal cycle to regional coastal changes" can be found here - it concerns itself with the effects of MHWL or mean high water level on erosion and sedimentation along the north-west coast of South America.

MHWL or mean high water level is the average of high water level (maximum tidal height) over the period under consideration. MHWL is accompanied by MLWL, mean low water level, and mean sea level is approximately half way between. The main conclusions of Gratiot et al. aren't disputed here; it seems perfectly logical that higher tidal levels cause greater shoreline erosion and that the nodal tidal cycle, which amplifies and reduces MHWL over an 18.6-year cycle has a significant effect. However, the last paragraph of the paper introduces another topic entirely; a claimed link between the NTC and mean sea level.

What I find amusing is that it isn't even necessary to understand the NTC. what causes the NTC to amplify tidal cycles worldwide, or even the extent of that amplification, to use the accompanying chart in Gratiot et al. to disprove their supplementary (and alarming) claim. However a brief description of the NTC might make things a little clearer. The Moon's orbit is inclined relative to the Earth's orbit around the Sun, which means that the Moon and the Sun pull on the oceans at a slight angle to one another. The lunar nodes are the points where the Moon's orbit crosses the plane of the Earth's orbit. When the Moon is at one of these nodes the Moon and Sun exert their pulls along the plane of Earth's orbit, and the total is greater than at other times. High water is at its highest during that part of the 18.61-year cycle, low water is at its lowest. 9.3 years either side, the effect is opposite, high water is reduced, low water increased. Back to Gratiot et al.
This study confrms the hypothesis that low tidal constituents are a major controlling factor in the evolution of the very gently sloping muddy coastal plain and shoreface of the Guyanas. Although tides have no effect on the long-term sea-level trend, they induce important fluctuations of the MHWL, when considering decadal timescales. As this timescale is particularly important for shoreline management and for policy makers, it is crucial to highlight the shoreline fluctuations associated with the 18.6 year cycle. From now to 2015, the coast of the Guyanas is expected to retreat by about 150m, 60% of this retreat resulting from the effect of the low-frequency tide constituents and 40% from sea-level rise due to global change. The nodal tidal cycle has a predictable effect on the tidal amplitude everywhere. It modulates the tidal amplitude by about 3% so that regions experiencing macro-tidal regimes are particularly concerned. Over the next decade, many coastal areas in Australia, Canada, China, England and France will experience a sea-level rise of several tens of centimetres due to the 18.6 tidal cycle (Fig. 3). This rise will contribute significantly to coastal erosion generated by global sea-level rise.
After having said that "tides have no effect on the long-term sea-level trend", they then say that "many coastal areas in Australia, Canada, China, England and France will experience a sea-level rise of several tens of centimetres due to the 18.6 tidal cycle". They mean of course that the mean sea-level will rise due to the increase from the low phase of the cycle in 2006 (see the chart above) to a high point some 9 years later. Here is their Fig.3, though from the preprint version of the paper - in the published version the title has vanished.
Figure 3 Predicted shifting of the MHWL under the 18.6 year nodal cycle for the next decade. (Adapted from the global map of tidal amplitude proposed by ref. 29 by considering a modulation of signal of 3%.) Grey areas correspond to locations of decrease or negligible rise. The black box (48W-62W-2N-12N) delimits the mud bank system of the Guyanas, South America.
Ref. 29 is Simon, B. La Marée Océanique Côtière (Institut Océanographique, Paris, 2007) if anyone's inclined to follow it up. Babel Fish translates "La Marée Océanique Côtière" as "The coastal ocean tide" which makes sense, if not good grammar, whereas Google Translate mangles it into "Tide Ocean Resort", which has a distinctly commercial flavour to it.

Note however how "Predicted shifting of the MHWL" in the caption becomes "sea-level rise" in the text. Note also that the sign of the "sea-level rise" is always positive; the scale has no negative part. This chart therefore must represent global sea-level rise due to a modification of tidal cycles. It demands the question - where does the water come from to generate this global rise? A second question - where did the water go to generate the implied previous 9-year low? A third question - why do none of the areas claimed as most affected show any part of such a large rise since 2006, nor any similarly large dip of "several tens of centimetres" over the previous 9 years? Their original chart is presumably based on a version of this one

Source: Aviso
.... which shows the lunar component of the global tides.

Their first mistake is assuming that the effect of the NTC is to amplify the tidal range by 3% globally; it does not. Several papers show the effect to be around +-5cm in the English Channel and North Sea, rather than the +-18-30cm their chart shows. The effect along the US Atlantic coast is greater than their chart shows, and the effect along the SW coast of Australia is also greater than their 3%, which I assume they calculated for their area of study, French Guyana and Surinam.

Their second mistake is a simple statistical one; if a range broadens, the difference between the mean of the range and the new maximum increases by only half the broadening. A range of 10-20 has a mean of 15, broadening to 10-30 increases the mean to 15. A range of 10-20 which broadens about its centre, the mean, produces no change in the mean at all. So even if the NTC produces an increase in the MHWL of 10cm, the mean can't increase by any more than 5cm. Even if they are correct in their assumption that an increase in MHWL produces a change in MSL, the latter can't possibly be equal to the former. In fact, tidal cycles expand and contract about their centre as I will show in detail in a later post, and as the NTC produces a simple broadening and shrinking of those cycles, it can't possibly cause any measurable change in MSL. I intend to write to the journal editors on the topic of the logical fallacies in the last paragraph in Gratiot et al., 2008.

A little background information here - It was this very topic, the Nodal Tidal Cycle, which got me interested in studying sea-level change several years ago. Having read of the claimed effect on local MSL, I decided to look for evidence in tide-gauge records. If the effect was as large as claimed, the effects should be obvious. I didn't expect to find that all sites would show it; I'd have been satisfied with a few clear examples. In short, I found none. I did find a few articles where the gauge record appeared to show some correlation for just a part of the record. Adjacent gauge sites I checked didn't show the effect at all, a fact curiously omitted by the authors. I even found a couple of published papers claiming to have found the effect. Their statistical "proof" was, to be candid, laughable. Most authors who refer to and study the effect of the NTC on MHWL, and its effect on erosion or some other phenomenon don't in general mention MSL; if they do, they don't link it with the NTC. Here's the abstract for one paper which does;
Nodal Tidal Cycle of 18.6 Yr.: Its Importance in Sea-Level Curves of the East Coast of the United States and Its Value in Explaining Long-Term Sea-Level Changes
Clifford A. Kaye and Gary W. Stuckey
The 18.6-yr cycle of the Moon's nodes dominates the annual means of high water, low water, and range at Boston and at other East Coast harbors. The maxima and minima of the high-water and range curves agree closely with the 180° and 0° long. yr, respectively, of the Moon's ascending node, and are fairly well accounted for by tide-prediction equations. The curve of annual mean sea level also reflects the cycle, but more weakly. Recognition of the cyclical nature of tidal data both simplifies and clarifies assessments of longer term sea-level trends and points to the need to include only multiples of entire cycles in the computations of these trends. When the curves of mean high water and range are used, it is possible to recognize long-term sea-level trends rapidly and to determine whether these are attributable to tidal or nontidal causes. The data suggest that the secular sea-level rise during the 20th century is tidal in origin and may be caused by vertical movement of the oceanic floor. This has the effect of reducing the volume of ocean basins, and, by changing basin geometry, alters the characteristics of terrestrial tidal constituents (standing waves).
Now I'd say that if the "secular sea-level rise during the 20th century" was caused by "vertical movement of the oceanic floor", then it's clearly not "tidal in origin". They also say that "The curve of annual mean sea level also reflects the cycle, but more weakly", while providing no proof in the text but for Boston, just one of the many sites they analysed. I'll be covering their assessment in a later post.

The realisation that the NTC simply amplified tidal cycles and didn't shift their mid-points soon dawned on me. Put simply, if high water increase due an effect on the gravitational pull of the moon, that water has to come from somewhere. The "somewhere" is in fact two "somewheres", the areas at right angles to the Earth-Moon axis along which the Moon exerts its pull. Those areas see lower tides as a result, and as the Earth rotates though the "tidal bulge" the point experiencing the higher tide experiences the lower tide some 6 hours later. The Gratiot et al. paper hasn't got a "somewhere" to act as a source for their claimed increases, ergo those worldwide increases can't happen, and Mörner's link between MHWL and sea-level is spurious.

I haven't actually provided any actual proof - you know graphs and stuff, that what I claim about the non-effect of the NTC on local mean sea-level is correct. That's for a later post, already in preparation. In the meanwhile, I'll return to my comment on Mörner's reproduced chart. The source is Fig. 1c in the Gratiot et al. paper (my bold in the caption)

c, Nodal cycles of the mhwl in Surinam and French Guiana. From 1958 to 1978, tidal gauge measurements in the mouth of the Surinam river ; from 1979 to the present, data from the tidal model of the Service Hydrographique et Océanographique de la Marine (SHOM, France www.shom.fr/ann_marees) obtained from tidal gauge measurements on Devil’s Islands (French Guiana). The corresponding phases of overall erosion and colonization reported by previous studies and in this work are shown as red and green patches. 
As I said, It's not a tide-gauge record and it doesn't show MSL but MHWL. I've never seen a tide-gauge record which looks like that, with a smooth multi-year cycle - no-one has. I'll overlook the fact that it's stitched-together from two sources. I'll even overlook that it doesn't cover "three 18.6-year tidal cycles". What I can't overlook is misrepresentation. Perhaps we sceptics should be more sceptical of what's claimed as proof - from "friends" as well as the "other side".