Saturday 21 January 2017

Supreme Irony #2 - Mauna Loa and Hawaiian Temperatures

Supreme irony #1 was of course "Assessing Recent Warming" which I posted on the 7th. of this month, in which I pointed out that the temperature at Washington Airport, just across the Potomac river from the capital, home of NOAA and the then president "Halt climate change" Barack Obama, had shown no warming since 1974. This time I start with the Mauna Loa Observatory, home of the "Keeling Curve" of atmospheric CO2 concentration. Here's a superb topographical map of Hawai'i Island, known in the state of Hawai'i as "Big Island", for obvious reasons - its area is greater than all the other islands of the archipelago put together. If you want to save a copy, click on it and right-click "save image as" or whatever your browser uses:


The red circle marks Lo'ihi, a "sea-mount", an active undersea volcano which will eventually break the surface (in at least decades) as a new addition to the island chain. Mauna Loa is the big brown peak in the middle, and a dirt track leads eastward to the town of Hilo, where there's Hilo Airport, home to an atmospheric weather station. There they record temperature etc, and launch radiosondes to measure temperature, humidity and ozone to 30-35 km altitude:

Steve about to release a radiosonde. Source: NOAA Earth System Research Laboratory.

Check out the link to ESRL - well worth a read, and abstracts of papers on the role of ozone in climate included. The big "hill" in the background is dormant volcano Mauna Kea, at 4205 metres the highest point in the islands. Notice the grey volcanic soil - it took a great deal of work from the 1920s onwards to level the site for the airport, cutting away hard volcanic rock. Read about that here if you're interested - it's another good read. Happily, all the fixed surface instruments are on grass - I'd imagine that soil would get hotter than tarmac in the sun. OK - enough background stuff - cut to the chase, and the temperature record for Hilo Airport since 1950 - the reason for the start date will become clearer later.
Hilo Airport 1950-2016.  Source: GISS

I've circled 1966 in red - no warming since then until 2015-6. Global Warming delayed by a mere 50 years. Next temperature station to the NW is at Kahului Airport on Mau'i Island:
Kahului Airport, Mau'i.  Source: GISS

No warming at all since 1977 - I can't use a Loess filter because of the gap from 2005 to 2009, so I've plotted a linear trend 1977-2016. It's essentially flat. Skip an island or two with no current data, and we come to Honolulu, the capital city, and of course UHI - Urban Heat Island effect. Has that affected the temperature record? Almost certainly, however:
Honolulu Airport 1950-2016.   Source: GISS

I've circled 1984 - no warming since then. Notice there's no 2015-16 "spike" either, as seen at Hilo. I suspect something has happened there to cause it. I'm checking it out. Last but not least, further to the NW is Lihue, Kaua'i Island:
Lihue, Kaua'i, 1950-2016.   Source: GISS

No warming since 1970 (circled). So there we have it - an entire US state with a documented lack of "Global Warming" - it never was global, and there are many places all round the globe showing either a total lack of late-20C warming, or even cooling. If many Sceptics would stop their incessant and negative complaining about GHCN/GISS adjusted and "homogenised" temperature data, and actually use the extensive unadjusted database, there's an Aladdin's cave of debunking material to be extracted and put to good use.

Why did I start most of the charts at 1950? I found a real little gem from the EPA, "What Climate Change Means for Hawaii". It kicks off:
Hawaii’s climate is changing. In the last century, air temperatures have increased between one-half and one degree (F).
Not a very good start - even though my charts above start at 1950, it's clear there's been a rise of around 1°C (almost 2°F) since then, and on full plots as much as 2°C (3.6°F) over the last 100 years. There's even a graphic to illustrate their error:

It's clear that Honolulu (top, brown) has increased from below 76°F to well over 77°F. There's no mention of the fact that even on this confused and confusing spaghetti-chart, it's clear that Honolulu hasn't warmed since the mid-1980s; that Hilo hasn't warmed since the mid-1960s; that Lihue hasn't warmed since about 1970, and that Kahului (grey, barely visible) hasn't warmed since the late 70s.

After some waffle about ocean warming (they say about 1°F) around Hawaii damaging coral reefs, there's this:
Greenhouse gases are also changing the world’s oceans and ice cover. Carbon dioxide reacts with water to form carbonic acid, so the oceans are becoming more acidic. The surface of the ocean has warmed about one degree during the last 80 years. Warming is causing snow to melt earlier in spring, and mountain glaciers are retreating. Even the great ice sheets on Greenland and Antarctica are shrinking. Thus the sea is rising at an increasing rate.
Errr - CO2 reacts with sea-water, but it doesn't form carbonic acid (H2CO3). The author's using kindergarten science. Even highly-carbonated soft drinks have only very tiny amounts of carbonic acid in them. Most of the CO2 remains as CO2 in solution. Look it up, as I did, whereas this author, in common with many alarmists and their camp-followers, never have. Sea-water is strongly buffered, and the addition of CO2 reduces the alkalinity (negative pH) only a little.  Saying that CO2 increases "acidity" is like saying that a reduction in your bank overdraft has "increased your bank balance".

Warmer air can certainly hasten snow-melt in spring, but it would take decades to centuries for slightly warmer air to have any effect on glaciers and ice-shelves. Air simply hasn't got the heat capacity and therefore content to do it over a few years, despite what glaciologists touchingly believe - they do have very vivid imaginations, and clearly know no relevant physics. A strong negative feedback is that melted surface ice (water!) evaporates, cooling the water. Latent heat of evaporation for water is an order of magnitude greater than latent heat of fusion for ice. Glaciologists also touchingly believe that surface melt-water can "permeate cracks in the ice" to reach the bottom of a glacier and "lubricate the base", so the glacier will advance faster. Ice-cold water can somehow permeate ice which is below freezing point to reach the base? Yeah, right - more "settled science".

Try heating your bath water using a fan-heater in the bathroom (don't try this at home!). In a well-insulated room, it would take weeks for the water to reach equilibrium with the hot air temperature. Topic for a future post here!

"Thus the sea is rising at an increasing rate." - well it's not. The "great ice sheet" on Greenland was shrinking, but that's slowed in recent years, not accelerated.  The only part of the "great ice sheet" on Antarctica to display any melting was at the northern end of the Antarctic Peninsula - the very tip is even outside the Antarctic circle. Several papers published recently show that the "increasing temperatures" on the peninsula flattened off after 1990, and have been decreasing over the last 10-15 years. Topic for another post!

Satellite data shows global sea-level to be increasing at about 3 mm/year since 1993, and despite what some Sceptics would have you believe, in general, satellite data agrees fairly well with tide-gauge data. However, a big factor in the 3 mm/year figure was due to surface warming in the western Pacific, that's PDO and ENSO related, and both indices are reversing trend. Also, the satellites sample a lot of sea surface where there are no tide-gauges, and so it's likely that previous estimates of global rise have been under-stating the case for many decades. In general, tide-gauges show no late 20th.C acceleration correlating with atmospheric warming at all. Dozens of mainstream papers document that. I'll finish this post soon, I promise, just one last quote:
Since 1960, sea level has risen between two and eight inches relative to Hawaii’s shoreline. Sea level rise can make Hawaii’s existing coastal hazards—such as waves, hurricanes, tsunamis, and extreme tides—even worse. Additionally, rising sea level has accelerated coastal erosion, which has resulted in wetland migration and cliff collapse. Chronic erosion has affected more than 70 percent of Kauai and Maui’s beaches over the last century.
"Between two and eight inches" is a pretty wide estimate. Eight inches is the accepted estimate for global rise from 1880. I'll go into that in a post (in preparation) about sea-levels around the archipelago. I accept that many beaches have suffered "Chronic erosion", but I contend that the main reason is steeply-shelving beaches, which are prone to "Chronic erosion" whether sea-level is rising or not. That's well-documented. Have a look at this from the same EPA document:


Firstly, that pale golden sand is not Hawaiian sand. The islands are composed of very dark basaltic rocks - they're the tops of very large volcanoes. The natural colour is the same as the soil in the "balloon" picture above. The islands are famous for their "black beaches". Secondly, it's easy to see that the bottom shelves steeply down from the beach. This is the flank of a volcano, after all. The beaches aren't threatened by "climate change" but by natural erosion and longshore currents and rip-tides off the beaches - they're well documented too. Currents dangerous for swimmers erode beaches. Rising sea-levels must play a small part, and a gradually increasing part, but these exaggerated claims are just the usual "blame everything bad on climate change" meme. "What Climate Change Means for Hawaii" is just the usual alarmist nonsense, permeated by a few truths. Par for the course,

Sunday 8 January 2017

Antarctica Larson C ice shelf close to becoming one of biggest icebergs ever - or not

Really? The entire ice shelf? It must be true, if the Christian Science Monitor says so:
Antarctica's Larson C shelf is about equal to the area to the state of Delaware. Its collapse might be imminent. 
JANUARY 6, 2017 —Scientists with the British Antarctic Survey now believe that the fracturing of the Larson C ice shelf from the polar cap is imminent, after a rift in the shelf grew vertiginously in the last month of 2016. 
The thread connecting Larson C to the rest of Antarctica is now just more than 65,600 feet long, surveyors from the Britain’s Project Midas say. 
Apart from the ice shelf being about equal in area to Delaware, not one of the statements is correct. They're not simply misquotes. The BAS scientists believe nothing of the kind - their article is titled Giant iceberg set to calve from Larsen C Ice Shelf, and that the calving is imminent. Surveyors from Britain’s Project Midas believe nothing of the kind either. They wrote: (my bold)
Larsen C Ice Shelf poised to calve
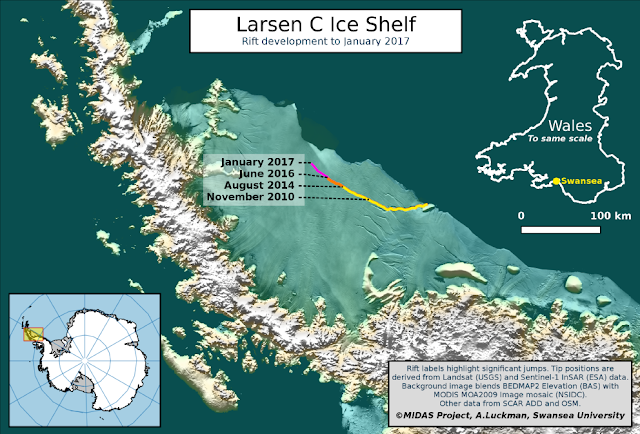
The Larsen C Ice shelf in Antarctica is primed to shed an area of more than 5000 sq. km following further substantial rift growth. After a few months of steady, incremental advance since the last event, the rift grew suddenly by a further 18 km during the second half of December 2016. Only a final 20 km of ice now connects an iceberg one quarter the size of Wales to its parent ice shelf.
No one but a moron could fail to grasp what those articles stated and meant. CSM author David Iaconangelo clearly isn't a moron, but is what might be euphemistically termed "economical with the truth".

Grist isn't much better - an editor retitles a "cross-post" and reorders images with captions removed to give a very different impression to the linked Climate Central article.

"Antarctica’s fourth biggest ice shelf is on the verge of collapse" shrieks Grist. However, the picture at the top of the page

.... is of the Larsen B disintegration in 2002. There's no caption, nor is it referred to in the text. Below the author's name is stated "Cross-posted from Climate Central". That link is to the article by CC author Andrea Thompson, titled Large Iceberg Poised to Break Off From Antarctica. Does she, or any of her quoted sources think "Antarctica’s fourth biggest ice shelf is on the verge of collapse"? No, this is just Grist once again changing a word or two, or misquoting a link or two, to push its catastrophic view of anything that might be remotely connected to what they think is the coming apocalypse. Also, that picture has been cropped to remove a distance scale at the bottom, as the Larsen B was about the size of the piece splitting from Larsen C. The scale might give the game away.  The one in the CC article, is captioned quite correctly The breakup of Antarctica's Larsen B ice shelf as it looked on Feb. 23, 2002. Click image to enlarge. Credit: NASA
The breakup of Antarctica's Larsen B ice shelf as it looked on Feb. 23, 2002.
Click image to enlarge. Credit: NASA

It's not a "cross-post" - Grist has altered the title, removed image captions, and reordered images from the CC article, to create the impression that the images are of Larsen C. Removing captions, editing images, and showing them out of context to create an impression not intended by the original author is more than breaking the rules of attribution, it's fraud.

Unusually, I find the CC article generally factual, informative, and links back up the text, though there are one or two disputed claims.

Author Andrea Thompson headed her article with this close-up image of part of the rift:
A large rift in Antarctica's Larsen C ice shelf, photographed by NASA's IceBridge mission on Nov. 10, 2016. The rift surged ahead by about 10 miles in late December.
Click image to enlarge. Credit: NASA/John Sonntag


In the Grist "cross-post", that image follows a a paragraph about the disintegration of Larsen B, and has the caption "NASA". The intention is now obvious, and totally unforgivable.

On a more factual note, the rift is about 500m (metres, not miles) wide, 350m deep in the centre, and is currently about 80km long, according to Project MIDAS. Some articles say 80 miles, and if the scale on the graphic below, is accurate, 150 km would be more like it. Not that it matters to you maybe, but I'll check. It's not unusual for genuine mistakes to go unnoticed by authors:
Source: Project MIDAS

The graphic is of more than a little personal significance - I was born just about where the second "s" in Swansea is located top right (although Wales is a little further north, and a lot warmer than its position on that graphic.

I've read a few articles that say words to the effect that the rift has just been discovered (where did they get that?), but it's been monitored since 2011.

Even the BBC managed to get it right:

Huge Antarctic iceberg poised to break away 
An iceberg expected to be one of the 10 largest ever recorded is ready to break away from Antarctica, scientists say. A long-running rift in the Larsen C ice shelf grew suddenly in December and now just 20km of ice is keeping the 5,000 sq km piece from floating away.
Larsen C is the most northern major ice shelf in Antarctica.
Researchers based in Swansea say the loss of a piece a quarter of the size of Wales will leave the whole shelf vulnerable to future break-up.
Larsen C is about 350m thick and floats on the seas at the edge of West Antarctica, holding back the flow of glaciers that feed into it.
Researchers have been tracking the rift in Larsen C for many years, watching it with some trepidation after the collapse of Larsen A ice shelf in 1995 and the sudden break-up of the Larsen B shelf in 2002.
They even end the piece with
"We are convinced, although others are not, that the remaining ice shelf will be less stable than the present one," said Prof Luckman.
"We would expect in the ensuing months to years further calving events, and maybe an eventual collapse - but it's a very hard thing to predict, and our models say it will be less stable; not that it will immediately collapse or anything like that."
As it floats on the sea, the resulting iceberg from the shelf will not raise sea levels. But if the shelf breaks up even more, it could result in glaciers that flow off the land behind it to speed up their passage towards the ocean. This non-floating ice would have an impact on sea levels.
According to estimates, if all the ice that the Larsen C shelf currently holds back entered the sea, global waters would rise by 10cm.
All that is very much in the future. There are few certainties right now apart from an imminent change to the outline of Antarctica's icy coast.
"The eventual consequences might be the ice shelf collapsing in years to decades," said Prof Luckman,
"Even the sea level contribution of this area is not on anybody's radar; it's just a big geographical event that will change the landscape there."
Prof. Luckman is one of the Project MIDAS team, based in Swansea. I like very much "We are convinced, although others are not...". It shows some humility, the acknowledgement that it's a personal team view. A good note to end on.

UPDATE 10/1/2017

I've been scanning through articles on the British Antarctic Survey website. I've always thought
the BAS to be a reactionary and somewhat alarmist bunch. I had already noticed this, on the page referenced above:
Glaciologist Professor David Vaughan OBE, Director of Science at British Antarctic Survey, said, “The calving of this large iceberg could be the first step of the collapse of Larsen C ice shelf, which would result in the disintegration of a huge area of ice into a number of icebergs and smaller fragments.
“Because of the uncertainty surrounding the stability of the Larsen C ice shelf, we chose not to camp on the ice this season.  Researchers can now only do day trips from our Rothera Research Station with an aircraft nearby on standby.”
In 2015 they said this:
The team, who continue to monitor the ice shelf closely, predict that a collapse could occur within a century, although maybe sooner and with little warning. A crack is forming in the ice which could cause it to retreat back further than previously observed. The ice shelf appears also to be detaching from a small island called Bawden Ice Rise at its northern edge.
"Within a century" - what's changed in the 19 months since that statement? Prof. Vaughan has dramatically changed his view - back in 2015:
Professor David Vaughan, glaciologist and Director of Science at BAS, says:
“When Larsen A and B were lost, the glaciers behind them accelerated and they are now contributing a significant fraction of the sea-level rise from the whole of Antarctica. Larsen C is bigger and if it were to be lost in the next few decades then it would actually add to the projections of sea-level rise by 2100.
On the same page - "within a century" and "the next few decades". However, contradictions like this aren't unusual on the BAS website. Members have very differing views, and careful reading reveals very different "facts" too. The thickness of the Larsen B shelf, which disintegrated in 2002, is given as 200 metres, and on one page a very unlikely and obviously incorrect 1km. That last article I quoted, actually a press release titled New study shows Antarctic ice shelf is thinning from above and below has this lead-in:
The Larsen C Ice Shelf — whose neighbours Larsen A and B, collapsed in 1995 and 2002 — is thinning from both its surface and beneath. For years scientists have been unable to determine whether it is warming air temperatures or warmer ocean currents that were causing the Antarctic Peninsula’s floating ice shelves to lose volume and become more vulnerable to collapse. This new study takes an important step forward in assessing Antarctica’s likely contribution to future sea-level rise. 
The research team combined satellite data and eight radar surveys captured during a 15-year period from 1998–2012. They found that Larsen C Ice Shelf lost an average of 4 metres of ice, and had lowered by an average of one metre at the surface. 
Lead author, Dr Paul Holland from British Antarctic Survey (BAS), says:
“What’s exciting about this study is we now know that two different processes are causing Larsen C to thin and become less stable. Air is being lost from the top layer of snow (called the firn), which is becoming more compacted — probably because of increased melting by a warmer atmosphere. We know also that Larsen C is losing ice, probably from warmer ocean currents or changing ice flow. 
“If this vast ice shelf — which is over two and a half times the size of Wales and 10 times bigger than Larsen B — was to collapse, it would allow the tributary glaciers behind it to flow faster into the sea. This would then contribute to sea-level rise.”
The Antarctic Peninsula is one of the fastest warming regions on Earth, with a temperature rise of 2.5°C over the last 50 years.
"Air is being lost", "probably because of increased melting by a warmer atmosphere". Here's a plot of the "warmer atmosphere" since 1995:
Larsen C - GISS unadjusted data.


I don't think so. What's amazing, is that many glaciologists and climate scientists never keep up-to-date with the latest data, but rely on published papers, many of which are out of date within a few years. I read something a dated a few weeks ago by a glaciologist, publishing regularly in this field, who cited "the continuing warming on the Antarctic Peninsula". An Ostrich is a large flightless bird, claimed to occasionally put its head in the sand. Some scientists are sightless birds, with their heads continually in the sand. More on the "continued warming" (/sarc off) soon.

Saturday 7 January 2017

"Assessing recent warming" (2017) put in perspective

ScienceMag (AAAS) published a "rebuttal" of the whole idea of any 21st century pause in global temperature increase a few days ago. The Sceptical blogosphere is awash with indignant posts (and comments) claiming data tampering, or "torturing the data until it confesses". I'm reserving my judgement, except to say that the "pause" has been widely acknowledged by climate scientists, referred to in the last IPCC report (AR5), and concerns surface temperature. The Hausfather et. al. article (not AFAIK peer-reviewed, not that that means much these days) concerns sea surface temperature, a wholly different kettle of fish (I really didn't think of that as a pun, honest!).
ABSTRACT 
Sea surface temperature (SST) records are subject to potential biases due to changing instrumentation and measurement practices. Significant differences exist between commonly used composite SST reconstructions from the National Oceanic and Atmospheric Administration’s Extended Reconstruction Sea Surface Temperature (ERSST), the Hadley Centre SST data set (HadSST3), and the Japanese Meteorological Agency’s Centennial Observation-Based Estimates of SSTs (COBE-SST) from 2003 to the present. The update from ERSST version 3b to version 4 resulted in an increase in the operational SST trend estimate during the last 19 years from 0.07° to 0.12°C per decade, indicating a higher rate of warming in recent years. We show that ERSST version 4 trends generally agree with largely independent, near-global, and instrumentally homogeneous SST measurements from floating buoys, Argo floats, and radiometer-based satellite measurements that have been developed and deployed during the past two decades. We find a large cooling bias in ERSST version 3b and smaller but significant cooling biases in HadSST3 and COBE-SST from 2003 to the present, with respect to most series examined. These results suggest that reported rates of SST warming in recent years have been underestimated in these three data sets.
Here's Figure 1 from the article:


Fig. 1 Comparison of the different ERSSTv3b, ERSSTv4, buoy-only, and CCI SST monthly anomalies from January 1997 to December 2015, restricting all series to common coverage. ERSSTv4 is shown as a broad band for visualization purposes; this band does not represent an uncertainty range. The series are aligned on the 1997–2001 period for comparison purposes. Spatial trend maps are also available in fig. S1, and a similar comparison with Argo data is shown in fig. S2.

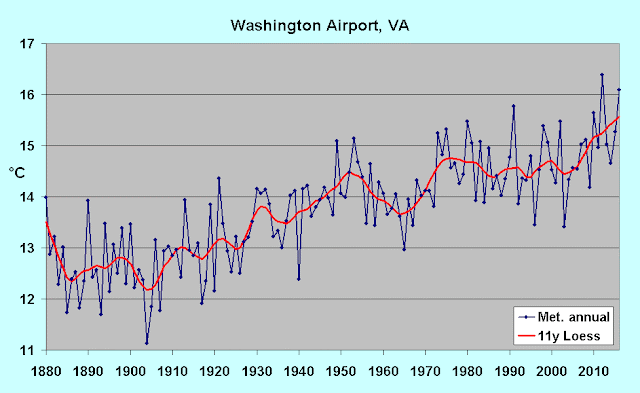
What it amounts to, is that the authors have found data series which match their agenda, and found reasons to ignore the other data series which don't. Par for the course these days. As it happens, I've been compiling a set of regional temperature records using GISS data (unadjusted of course), since before Christmas. Just to be different, I'm not ignoring data which doesn't match my agenda, I'm concentrating on large areas of the globe which show interesting results on analysis. More in later posts. For the moment, I thought it might be interesting and amusing to look in detail at the temperature record nearest to President Obama's residence (soon to be vacant for a very short period) and NOAA  headquarters at 1401 Constitution Avenue, Washington DC. The thermometer is at Washington National Airport, just 5km across the Potomac river from NOAA, just inside Virginia.

1880-2016

The 11-year Loess filter shows an uptick around the middle 2000s, after a bumpy "plateau" from 1973. No late 20th C warming evident at all. However, the Loess filter works in a way which includes future change (weighted). If the filter range is constrained to 1880-2009, we get:

1960-2016, Loess range to 2009

Warming began in 2010, after a 27-year "pause". Washington itself would undoubtedly show warming, mostly due to the "Urban Heat Island" effect, but the airport is on the west bank of the Potomac, effectively rural and uncontaminated. A little ironic, that a thermometer just across the river from the nation's capital, seat of a president pledged to "halt global warming" shows no 21st C warming until 2010. The plateau runs from 1974, when he was 12yo - he can't claim responsiblity!

More soon, beginning with Pacific islands. Watch this space.