Sunday, 10 February 2013

Democrat Senator wants to see the end of mankind?

From the Washington Examiner (h/t Tom Nelson), my bold
Sen. Ben Cardin, D-Md., said that his colleagues want to pass a carbon tax in order to fight global warming and provide extra revenue as lawmakers debate debt and spending issues.
“We’re looking for revenue sources that are positive that we could get bipartisan support [for] such as a carbon tax to help finance the next transportation bill,” Cardin said during a National Institutes of Health town hall meeting today. He was responding to an NIH employing [sic] who suggested Congress “increase public health by eliminating carbon in our atmosphere and then also raise needed revenues to help stabilize the budget” in a question after during the town hall.
“I agree with your point,” he said. His office explained that the carbon tax “is connected to the public health impacts of climate change,” adding that “reducing carbon in the air would reduce the pollutants that are typically emitted at the same time, also reducing health costs.”
Does this loon (and his loony questioner) not realise that we're "carbon-based life-forms"? Do they not understand that plants, including the weed they must be smoking, get all their carbon from atmospheric carbon dioxide? That at the bottom of all food chains there are plants, whether it's grass for cattle or algae for fish or berries for birds?

There are certain things that need to be eliminated from this shining blue globe of ours, but carbon dioxide is most certainly not one of them. I have a short list of candidates however.

Nils-Axel Mörner - winner of the 2012 prize for science fiction

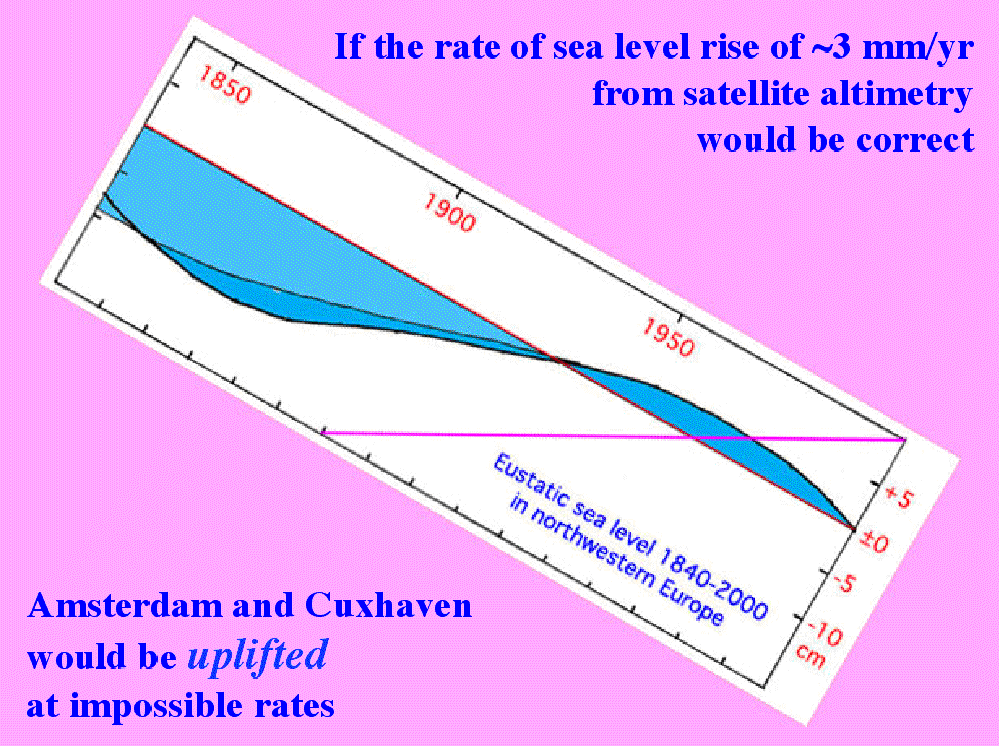
On 1st. December 2012, Nils-Axel Mörner showed the following slide (pdf at EIKE here) to attendees at a talk he gave (video here) during the seventh Heartland climate conference in Munich, entitled "Sea Level Rise - Fact and Fiction". Click to enlarge graphics.
Some of the "evidence" he produced, including this diagram, was fiction, and that which was not pure fiction was generally a misrepresentation of fact - not even the text on this slide is correct. He referred to it as "the current situation"; even those who are visually impaired can see it ends in 2000 - hardly "current" at the end of 2012. It's also a fiction because it doesn't include anything from Stockholm, as the text states, and as the following slide (below) shows; if it had it would be even more of a fiction, as Stockholm is pretty much in the middle of the Baltic, and far from the North Sea. It seems his geography is far from perfect, a failing he reveals elsewhere in his talk - a strange trait in a geologist.
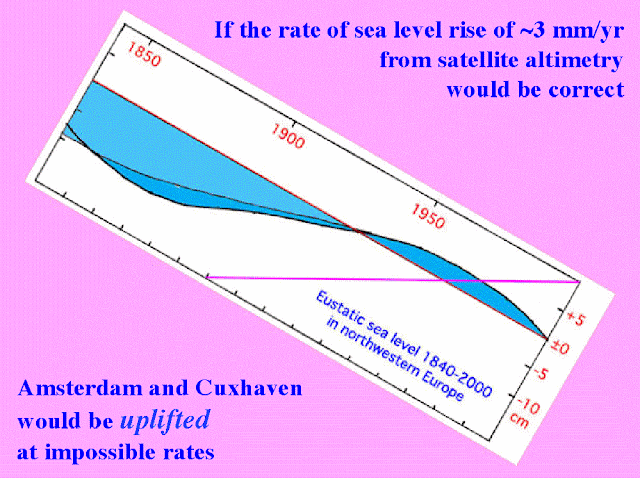
"Amsterdam and Cuxhaven" - wot, no Stockholm?
I know that there were no satellites orbiting in 1840, apart from the moon of course. The satellite altimetry record started in October 1992, and applying a global rate to Cuxhaven is sleight of hand.

To be fair to Mörner, I think he allows himself to be totally seduced by his own views and controlled by his mindset, and so lacks objectivity. It's behaviour exhibited by conspiracy theorists, and Mörner demonstrates it clearly with his claims of "personal adjustments" of satellite altimetry. All adjustments are published on the 'net, and there are technical forums where they're discussed. The unadjusted data, and adjustment algorithms and relevant data are all available for public access. Does anyone really think that altimetry maps would be produced that could be easily refuted by data from a few tide gauges? From the many tide gauges that are in fact used to check their accuracy? Claims to have shown map inaccuracy invariably have a fatal flaw - they don't compare apples and apples; they don't compare identical periods from the maps and gauges. Comparing apples with apples is to compare the exact rate at the location with the gauge record over the exact same period. Those who seek to debunk the satellite maps are not just comparing apples with oranges, they're setting up a fruit market. More (much more) in a later post on this topic.

The "North Sea" slide may show the only sea-level "chart" you've seen that Mörner's produced himself. I've found no evidence whatever he's ever downloaded and charted a gauge dataset. It's clearly hand drawn, and the main curve is taken directly from his previous slide which represented Cuxhaven ("Coxhaven" on the slide), on the North Sea coast of Germany, the "German Bight".

Even this graphic contains a slight fiction - note the "2003" in the bottom RH corner; it's in a different font size, and there's no corresponding "tick mark" on the axis. That corner represents 2000, not 2003, as the distance to the previous tick mark shows, and the PSMSL annual chart for Cuxhaven confirms.
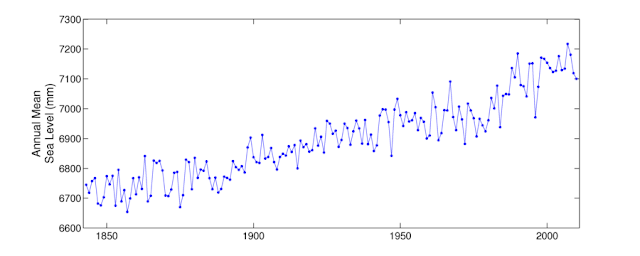
Cuxhaven 2 annual                                                                            Source:PSMSL
The 2000 tick mark at the top right is over what is the final broad spike on Mörner's graphic.

The red (subsidence rate) line is reproduced on the first slide as the zero line, which explains why it doesn't represent the mean, as is the convention with anomaly-type charts and diagrams. Both lines cross the polynomial curve at 1933, and this graphic shows that the curve diverges from the sea-level line after that point; it merely clips some of the spikes. Up to 1973 or so Mörner's plot matches the PSMSL plot very well; from then on it diverges suspiciously.
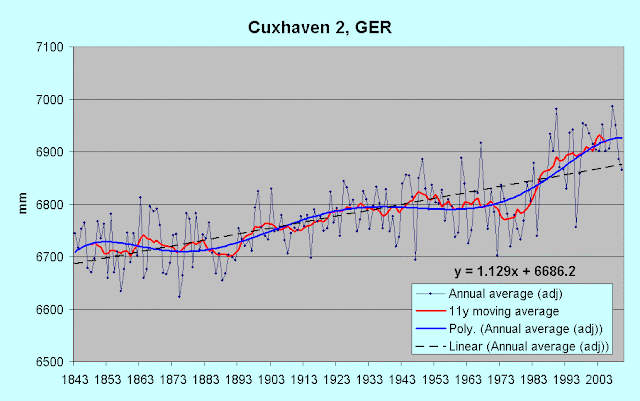
Cuxhaven annual (to 2010) adjusted down by 1.4 mm/year from 1844. Data source PSMSL
In "Sea Level is not rising" (SPPI), Mörner says he established the subsidence rate for the Cuxhaven gauge as 1.4 mm/year, so I've used it to adjust (downward) the annual plot for Cuxhaven. Published estimates for the subsidence rates along the Dutch and German coasts range from 0.6 to 0.9 mm/year. The chart is necessarily a little busy because I've added a polynomial curve (blue) to contrast with the curve in the first slide shown above; there's little similarity, and it's worth reproducing the diagram here for convenient comparison.
The text on the slide says "It fits the Earth's rotation (LOD) very well", but it doesn't represent any facts very well. Even if what is shown was true, it would say nothing of sea-level change elsewhere, not even in the North Sea. When land uplift or subsidence (from GPS monitoring stations) are taken into account, long-term North Sea sea-level change rates vary quite widely; some show an upturn in the last decade, some show a downturn, and some show no major variation in rate over the last few decades. Delfzijl is the next station to the west of Cuxhaven, and is just over the German border with Holland.

Delfzijl, Netherlands  Data source: PSMSL
It shows little similarity with the chart for Cuxhaven, shows little variation over the 20th century, and shows no slowdown after 1950.

Giving Mörner the benefit of the doubt, he's been seduced into believing that a polynomial curve supplied by someone else (see "Sea Level is not rising") reflects reality, and has based his sea-level "curve" on that. If he'd actually charted the record himself, with the most up-to-date data available, he couldn't have produced his curve. Data beats hypothesis hands down every time.

The previous slide to his "North Sea" curve (Cuxhaven curve, not quite the same thing) showed the PSMSL chart for Fremantle, Western Australia. Mörner never cites his sources for charts and diagrams and doesn't here; not a very polite nor ethical way of presenting such data.
Ignore that the title says 1897-2011 - it's 1897-2010. Ignore the "1893-2011" mean - Mörner's very bad with start and end dates, as we've seen earlier. Ignore his blatant "cherry-picking" of 1913-1956. Ignore that his "global eustasy" (absolute rise) was derived from just 2 1/2 gauge records in NW Europe (Amsterdam again!). Ignore that there's no source cited, he got it here, and I got the data for my Fremantle chart from the Australian BOM site.

This one's a real cracker though - Mörner commits what might be called evidential suicide. He's telling us that his absolute rate of 1.1 mm/year applies here, calculating a subsidence rate, then he's telling us that there was "little or no absolute sea level rise" which of course means that his rate of 1.1 mm/year doesn't apply here. It also shows no downturn after 2000. Nice one Prof.

I'll also tackle Mörner's famous (or infamous, depending on the point of view) Maldives paper later, which is flawed to the point of being worthless, but here's a taster from its third page (my bold)
The mean sea level seems closely to approximate the surface of a beach rock cut into a flat surface (a rock cut platform). The HTL is at + 0.45 m, the storm level at + 0.9–0.8 m, the sub-recent level is at + 1.2 m, and the old island surface at + 1.45 m. This seems to indicate that the island surface was built up at a 60 cm higher sea level and that the sub-recent level was formed at a 30 cm higher sea level.
A higher sea level of about + 60 cm in Late Holocene times is recorded in sandy environment (e.g. Hulhudhoo in the Baa Atoll) as well as in beach-rock environment (e.g. Fulhudhoo in the Guidhoo Atoll). The sub-recent level seems, in general, to have been at about + 30 cm (in sandy section of the Hulhodhoo as well as in the beach-rock coast of Fulhudhoo).
The most important and interesting fact is the sea level fall of about 20–30 cm between the sub-recent level and the present level. The morphology is clear.......
Beautiful logic chain here; seems.....seems....seems.....it's clear! I love that "seems closely to approximate" - how can something "closely approximate" something else? The language and logic "seems to closely approximate" that in IPCC AR4 "Summary for Policymakers", where a number of factors which are "likely" lead to a conclusion which is "very likely". How did he know what the "mean sea level" was, standing on a sandy beach with the waves lapping? All will be revealed in a later (but soon) post.

I'll also discuss his flawed methodology in general in a future post, along with examining more of his gaffes and sleight-of-hand. I thought (silly me!) that being sceptical meant demanding  "show me your evidence and your sources". Why has no-one on the sceptical side thought proper to actually examine his claimed evidence and his arguments in detail? Is he immune from such scrutiny? Is he to be believed no matter what he says? Is he infallible in some way, like the Pope? If the answer to any or all of these is yes, then his supporters are guilty of at best double standards and at worst religious adoration.

The audiences at his talks, and readers of his articles lap it all up. "Good old Prof" they chortle "He's sticking it to 'em!". "They" aren't impressed; "they" ignore and ridicule him alternately. He's sticking it to us, sceptics working to call into question shaky science and excoriate alarmists and alarmism. He's pissing into the wind trying to prove the unprovable, and it's sceptics in general getting the spray.

Wednesday, 6 February 2013

Wind Turbines - a carefully considered view

I hate 'em.

Orrin H. Pilkey - is he for real?

Who he? He's a (retired) geologist and "shoreline expert" (veteran beachcomber perhaps?) but he has pronounced, and is still pronouncing on sea-levels worldwide, global warming and climate change. Perhaps studying geology somehow qualifies someone to comment on everything climatological, like one Nils-Axel Mörner, with whom you may be familiar. Wikipedia says
Pilkey began his career with the study of abyssal plains on the deep sea floor. As a result of the destruction of his parents' house in Waveland, Mississippi in Hurricane Camille (1969), he switched to the study of coasts.
Better late than never, I suppose, and I'd suggest the name "Waveland" might have hinted at something earlier. Perhaps I'm being unkind, but I'm in one of those moods where my wit has a pH of 2.0 and the sarcasm fairly flies from my fingertips. I know that sarcasm's considered as the lowest form of wit, but it's fun.

Anyway, I came upon "Sea Level Rise And The World’s Beaches" on Coastal Care, penned by said (retired) Professor Emeritus of Earth and Ocean Sciences, Nicholas School of the Environment, at Duke University, Orrin H. Pilkey himself. I thought "coastal care" involved not dropping litter and following the country code "take only photographs, leave only footprints", and resisting the temptation to vandalise wind turbines, you know, that sort of stuff. You might deduce that I came upon this gem of science and logic purely by chance, and you'd be right. He begins
Of all the various anticipated impacts of global climate change, sea level rise will likely be the first to produce a human catastrophe on a global scale. Heavily populated low-lying lands on deltas (e.g., The Ganges-Brahmaputra Delta) will be abandoned, displacing millions of people. Atoll nations in the Pacific (Tuvalu) and Indian Oceans (The Maldives) will disappear; major cities (Miami, Rotterdam, New York/Newark) will be building storm gates and abandoning the low-lying city fringes. Barrier islands lined with tourist facilities and high-rise buildings along the world’s coastal plains will either be abandoned or will be completely surrounded by massive sea walls. Development-lined beaches everywhere will be degraded and more than likely will be destroyed.
Rotterdam already has a "storm gate" known as the Maeslantkering, completed in 1997. It works automatically, with warnings to shipping issued a coupla hours in advance. It's worth a look - when it comes to protection from the sea, the Dutch don't piss about - they build big and to last. This gate is just the northern half of the barrier, the two gates pivot out to meet in the middle of the waterway, when water is admitted to the curved caissons so they sink to the bottom. To allow this movement, the gates are supported on huge ball-joints (nearest the camera); they're 10 metres in diameter and weigh 680 tons each.

Northern half of the Maeslantkering                                                             Source: Geolocation
... those little dots on the right of the grey control building in the centre are cars in the car park. The Big Apple should have had more than one decades ago. In Miami they're relying on the pirate ship at Disney World. A queue might develop.

I think the Prof might have just the teeniest chip on his shoulder about storm surge. He continues, after discussing the last ice age and the result of its termination on sea-levels
Sea level change is actually a combination of the change in the volume of the sea (eustatic change) and the local up and down movement of the land (tectonic change). The rise is primarily occurring because the ocean water is expanding (thermal expansion). As the warming atmosphere transfers heat to the surface waters of the oceans, the waters gradually expand. The upper 2000 feet of the oceans are involved in this process and even though the amount of expansion per unit volume of sea water is slight, the huge quantity of water expanding in the oceans leads to a significant increase in the volume of the sea and hence to a rise in the level of the sea.
Even if we reversed global warming today, thermal expansion of the oceans would continue for centuries and probably millennia to come. This is because the downward motion of water warmed by contact with the warming atmosphere into deeper waters provides momentum like the momentum furnished to an engine by a flywheel. As the cold deep water is thus warmed it expands. At the same time, the loss of the warm water at shallower depths causes the water column there to shrink. The expansion at depth is greater than the contraction in shallow water so overall the ocean expands and the sea level continues to rise and will do so for a long time.
Wait a mo' - let me run over that again - "the downward motion of water warmed by contact with the warming atmosphere into deeper waters provides momentum like the momentum furnished to an engine by a flywheel". Silly me thought that warmed surface water expanded upwards taking it's centre of gravity with it - very slow upward motion and therefore momentum. The next sentence is convolutingly fascinating - "the loss of the warm water at shallower depths causes the water column there to shrink". The warmed water's not lost, it's still there, above the as-yet un-warmed depths. The un-warmed deeper water is unaffected - no temperature change, no volume change. The depth of the colder layer is reduced, the water there doesn't shrink. Water column 1000 metres, top 100 metres expands to 100.1 metres, bottom 900 metres is unaffected, result 1000.1-metre depth. Call for a shrink.

After some discussion of melting glaciers and icecaps - in the Prof's icy mind, all are shrinking, none growing, he says
Sea level is dropping in Juneau, Alaska, because the Mendenhall Glacier has retreated away from the coast and the land is rebounding, having been released from the glacier’s weight. This is a widespread phenomenon in high latitudes in the Northern Hemisphere (e.g., Scandinavia) where the ice sheets of the last ice age have recently (in a geologic time sense) melted away. It is also happening in Greenland and the Antarctic where the land beneath the ice rebounds upward as the weight of the thinning glaciers decreases.
Ummm no. The Mendenhall Glacier has certainly retreated in the last half-century or thereabouts, but it's just 12 miles (19 km) long, and its weight isn't that great compared with the mountains it slides down, a mere pimple compared with the depth of the crust. In any case, glacial rebound is delayed by centuries after top weight is reduced, so the land rebounds centuries after "the weight of the thinning glaciers decreases". I though geologists had a good sense of the timing and delayed action of crustal processes, and of scale. The Prof obviously has some difficulty conceptualising both, not a good trait in a geologist.

After some discussion of how rapidly (who said?) rising sea levels are and will increasingly affect coastal areas, he says
The point is that a very small sea level rise will cause a large shoreline retreat. Sea level rise is not to be easily dismissed.
Yet in the December 27, 2010, issue of Forbes magazine is an article that argues sea level is not rising. Swedish geologist, Nils Axel Mörner has written a pamphlet entitled Sea Level Rise is the Greatest Lie Ever Told. These and many other expressions of skepticism about sea level rise are part of a larger deniers movement largely funded by energy companies and libertarian organizations. It’s hard to fathom how a 150-year record of tide gauges and 19 years of satellite measurements of sea level change can reasonably be refuted.
The amount of shoreline retreat rather depends on the profile of that coastline surely. I certainly agree with him on that last point, though - it's certainly difficult to fathom how such records can be refuted - scope for a few future posts there perhaps.

Newton is claimed to have said or written
I do not know what I may appear to the world, but to myself I seem to have been only like a boy playing on the sea-shore, and diverting myself in now and then finding a smoother pebble or a prettier shell than ordinary, whilst the great ocean of truth lay all undiscovered before me.
IMHO the "great ocean of truth" is still eluding Orrin H. Pilkey (and many others, sceptics included), and he should continue his beachcombing in the hope of acquiring a little of Newton's insight, and a firmer grasp of what's beyond his experience and limited knowledge of the world and how it works. A little humility turneth away wrath perhaps, to mangle several epithets in one go. Over and out.

Alaska Climate "Fix-it" Group - what?

"Rapid-response taskforce – set up by Sarah Palin to protect state from effects of global warming – last met in March 2011" wails Suzanne Goldenberg, US environment correspondent of the UK Guardian. Question - why does the Guardian need a "US environment correspondent"? Haven't we got a UK climate of our own for neurotic correspondents to worry about? Just how exactly does the Immediate Action Work Group plan to "protect" Alaska - install large air-conditioners perhaps, or install a huge chain of wind-turbines driven by electricity to push all the superheated Arctic air back northwards, or erect a huge refrigerated plastic bubble over the entire state? Not exactly, they're gonna develop "alternative plans for comparison"
Immediate Action Workgroup’s Recipe for Success
Step 1: Begin by developing a collaborative organizational structure that can focus the combined capabilities of local, regional, state, and federal stakeholders on the problems at hand.
Step 2: Discuss the nature and extent of the potential climate change impacts and create an applied approach to addressing significant impacts, as described in Step 3.
Step 3: Identify the communities at risk, timeframe, and the true needs to address climate change impacts.
Step 4: Develop measures that meet the stated needs and combine those measures into alternative plans for comparison.
That'll sort it. They haven't included any plans for mitigating the increasing cold up there though - they think, as Goldenberg does, it's still warming:
Alaska, like other Arctic regions, is warming at a much faster rate than the global average. Last summer saw record loss of Arctic sea ice.
I refer the reader, Goldenberg, the Guardian, the Immediate Action Workgroup, and anyone else who needs a stiff dose of up-to-date reality to my post of 11th December last - Do "warmists" inhabit a different planet, or just blind and deaf? which shows GISS temperature charts for seven Alaskan stations, all of which show rapid cooling since 2000. The answer to the question posed in the title should be obvious.