Showing posts with label GISS. Show all posts

Wednesday, 20 March 2013

GISS/GHCN - Woomera, Australia, the "smoking gun"

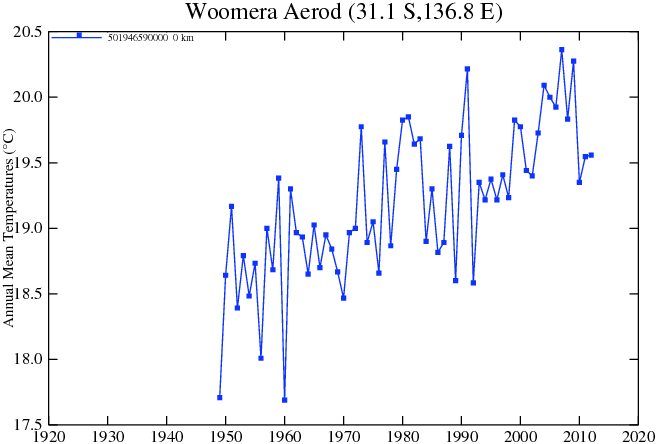
Having worked around Oz clockwise from Cairns, Queensland, I've arrived at Woomera, South Australia - where there was a rocket-testing range. However, it's GHCN and GISS who deserve a rocket, for their unexplained and totally unjustified adjustments of past temperatures. Here's the GISS chart for Woomera Aerodrome
... and the unadjusted data
..... and both datasets plotted together

What am I complaining about? There's hardly any adjustment evident at all. EXACTLY - why isn't there any? Here are the adjusted and unadjusted plots for Alice Springs, Northern Territory, just a tad up the road from Woomera (1,060 km or 657 miles to be exact).
Why does a town like Alice need a large adjustment for 1949 onwards and Woomera need none? Because Woomera already shows a warming trend! No earlier data, so no adjustment needed. This sort of fakery is scientific malpractice of the first order.

Tuesday, 19 March 2013

Adelaide, Australia - instant warming, just add GISS!

While gathering data to refute the "Hottest Oz summer EVAH" claims from the BOM and Climate Commission, and having already found no records broken while trekking through GISS data, I came across the following chart for Adelaide.

 ....... and thought I'd compare it with unadjusted data:

Instant warming! Warm the present and cool the past. Here are the two plotted together

The two plots "pivot" about 1960, where they coincide. Apart from the obvious one, I have a question - just who was flying from Adelaide Airport in 1881?

Wednesday, 6 February 2013

Alaska Climate "Fix-it" Group - what?

"Rapid-response taskforce – set up by Sarah Palin to protect state from effects of global warming – last met in March 2011" wails Suzanne Goldenberg, US environment correspondent of the UK Guardian. Question - why does the Guardian need a "US environment correspondent"? Haven't we got a UK climate of our own for neurotic correspondents to worry about? Just how exactly does the Immediate Action Work Group plan to "protect" Alaska - install large air-conditioners perhaps, or install a huge chain of wind-turbines driven by electricity to push all the superheated Arctic air back northwards, or erect a huge refrigerated plastic bubble over the entire state? Not exactly, they're gonna develop "alternative plans for comparison"
Immediate Action Workgroup’s Recipe for Success
Step 1: Begin by developing a collaborative organizational structure that can focus the combined capabilities of local, regional, state, and federal stakeholders on the problems at hand.
Step 2: Discuss the nature and extent of the potential climate change impacts and create an applied approach to addressing significant impacts, as described in Step 3.
Step 3: Identify the communities at risk, timeframe, and the true needs to address climate change impacts.
Step 4: Develop measures that meet the stated needs and combine those measures into alternative plans for comparison.
That'll sort it. They haven't included any plans for mitigating the increasing cold up there though - they think, as Goldenberg does, it's still warming:
Alaska, like other Arctic regions, is warming at a much faster rate than the global average. Last summer saw record loss of Arctic sea ice.
I refer the reader, Goldenberg, the Guardian, the Immediate Action Workgroup, and anyone else who needs a stiff dose of up-to-date reality to my post of 11th December last - Do "warmists" inhabit a different planet, or just blind and deaf? which shows GISS temperature charts for seven Alaskan stations, all of which show rapid cooling since 2000. The answer to the question posed in the title should be obvious.

Saturday, 15 December 2012

IPCC AR5 draft report release - the bottom line

An expert reviewer of IPCC AR5 (Assessment Report 5) has released the entire draft on the internet. it contains a graphic showing the global temperature "projections" from climate model runs from the previous four reports. Put simply, the graphic destroys any claims of continuous warming of the global climate since the publication of the FAR (First Assessment Report) in 1990. it destroys the claim made in a recent paper that the global temperature trend since then has vindicated the accuracy of projections from that FAR. It supports the observation of sceptics (and some enlightened and open-minded climate scientists) that global temperature has not increased this century, and that actual temperature data shows a trend well below IPCC projections. It is clearly the "elephant in the room" for proponents of CAGW (Catastrophic Anthropogenic Global Warming) and warmists and doomsayers in general.

Source: WUWT
The vertical black bars indicate the possible range of error in observations (square black dots) from the GISS temperature dataset; it's quite clear that there's been no increase in global temperature since 1998 and that temperatures are trending below the model projections from all four reports (the coloured bands). It should be obvious to anyone that climate models don't model the global climate; in principle they can't - the climate is a chaotic stochastic system that doesn't lend itself to modelling as stated in an early iPCC report, but that didn't stop climate modellers applying their magic computer code to predicting the unpredictable. It should be clear to anyone who studies the science in any detail that while there is an anthropogenic effect, it's quite small, and is highly unlikely to lead to any substantial warming of the global climate. It should also be clear that while CO2 is, and must be, a climate driver its effect is relatively small, and it's predicted effect on climate vastly overblown. Whatever the conclusions are in the published AR5, due next year, mankind is having no great influence on global climate.

The king is dead, and good riddance.


Tuesday, 11 December 2012

Do "warmists" inhabit a different planet, or just blind and deaf?

It's a good question - here are some hints as to the answer. HuffPo says "Global Warming Threat: Permafrost Thawing Across Siberia And Alaska Poses New Concern, UNEP Reports"
Permafrost lands across Siberia and Alaska that contain vast stores of carbon are beginning to thaw, bringing with it the threat of a big increase in global warming by 2100, a U.N. report said on Tuesday.
How can anyone come to that conclusion if they'd actually read the UNEP report, which said "Overall, these observations indicate that large-scale thawing of permafrost may have already started", and "Uncertainties are large, but emissions from thawing permafrost could start within the next few decades". May have, not has, and emissions could start within the next few decades. That "few decades" sounds like a solid scientific prediction doesn't it?

The Urban Times asks "How is Global Warming Affecting Alaska?", as if we and it's readers couldn't guess what their answer was gonna be.
The reasons for global warming have been thoroughly debated. While some experts argue humans are the root cause, others argue that the Earth is undergoing a natural climate shift that has nothing to do with the presence of people on the planet.
Whatever the reason, it is evident that global warming is taking place. In Alaska, for instance, the average annual temperature has risen just over three degrees Fahrenheit per year for the last 100 years. The resulting glacial reduction is visible to the naked eye.
They then show a photo of a glacier calving great chunks of ice into the sea, as if this is caused by higher temperatures and has never happened in the past, hint: RMS Titanic. I won't bore you with rest of the stuff and get on with my own picture; what's happening to temperatures in Alaska? I Just clicked on the GISS map somewhere in Alaska and then ran down the list picking out stations with a history to 2012 which is complete for recent years - no cherry-picking on my blog. Here are the charts, in the order they appear in the list. You're welcome to check for yourself using the links I've provided-  that's why I included them.


Notice anything about the years since 2000? If you do, and you deduce that temperatures have been dropping to or below those of the 1980s, you get full marks. You are now fully qualified to answer that question "How is Global Warming Affecting Alaska?".

Sunday, 12 February 2012

A Tale of Two Cities

I recently posted a chart of Los Angeles annual temperatures 1881-2011. Here it is again:

Los Angeles annual temperatures 1881-2011 GHCN via GISS
Looks like a fairly typical temperature chart - a warming trend into the 1930s, a dip in the 1940s, then a climb to a peak in the 1990s, followed by the un-typical dip to lower temperatures this century, the subject of that post. The data is GHCN (Global Historical Climatology Network) provided by the NOAA GISS website, and denoted as "unadjusted" which means no further adjustments by GISS. The GHCN data is most certainly adjusted however, as the following chart shows.

Los Angeles annual temperatures 1881-2011 GHCN vs Unadjusted (raw)
GHCN have lowered the raw data from 1881 to 1930 to produce a convincing upward trend. Note that the adjustment is progressively less, from a massive 1.9°C in 1881, smoothly to zero in 1930. There can be no justification for this "adjustment to fit an agenda", which is exactly what it is. Note the difference in the trend line slopes: from 0.08°C per century (raw), which is effectively zero trend, to 1.62°C per century. Instant global warming sans added heat. I've plotted data from the same sources for San Francisco:

San Francisco annual temperatures 1881-2011 GHCN vs Unadjusted (raw)
This is even more blatant jiggery-pokery, with a progressively increasing negative adjustment from zero for the present all the way back to 2.1°C in 1881. GHCN has turned a slightly negative (effectively zero) trend into a surprisingly (is it a surprise?) similar trend to that for Los Angeles of 1.62°C per century. The precise values are 0.016157 for LA and 0.016144 for San Francisco. Coincidence, perhaps, but I think not. I've seen some large GHCN adjustments, but the blatant fiddling here takes the prize.

As I said earlier, "instant global warming" without added heat. There are those who call sceptics "deniers". To those I say "explain or deny this if you can".

UPDATE 13th Feb 2011

I've just checked the GHCN data for both stations on the GISS site, and both have changed slightly since I downloaded the data on 7th Feb. I also had a dataset for SF from December last, and that's different too. Not just rewriting the past, but doing it regularly. I though only totalitarian regimes rewrote the past?

UPDATE 13th Feb 2011

Just a few minutes ago, I had displayed the GHCN temperature chart for Rochester, Minnesota, among others. With a dozen browser tabs open, I didn't realise that the chart was still displayed, so I reselected it from the GISS station selector, and displayed it again. Unbelievably, the data had changed by a few tenths of a degree (both for early and late years) within ten minutes! Some kind of official investigation is needed of this unjustifiable shenanigans.

Wednesday, 8 February 2012

Global Warming through the eyes of a True Believer

I was looking for something totally unrelated to global warming, climate change, blind meteorologists etc., when I stumbled upon "Golden State Heating Up, Study Finds" from 2007 on PhysOrg - not a site I've ever spent any time on in the past. I have seen a few links on Google News, but the brief summaries usually put me off - the site seems to be the haunt of dyed-in-the-wool believers in "settled science".
Average temperatures in California rose almost one degree Celsius (nearly two degrees Fahrenheit) during the second half of the 20th century, with urban areas blazing the way to warmer conditions, according to a new study by scientists at NASA and California State University, Los Angeles.
Of course, those who don't acknowledge the significance of the Urban Heat Island (UHI) effect wouldn't see the irony in that "urban areas blazing the way to warmer conditions".
The scientists found great variations in temperature patterns throughout the state. Average temperatures increased significantly in nearly 54 percent of the stations studied, with human-produced changes in land use seen as the most likely cause. The largest temperature increases were seen in the state's urban areas, led by Southern California and the San Francisco Bay area, particularly for minimum temperatures. Minimum temperatures at some agricultural sites showed increases comparable to some urban areas. Rural, non-agricultural regions warmed the least. The Central Valley warmed slowest, while coastal areas warmed faster, and the southeast desert warmed fastest.
Note "particularly for minimum temperatures" and "Rural, non-agricultural regions warmed the least" - the signature of UHI. No mention of that here, of course.

The paper (no title nor date mentioned - very useful) would seem to be LaDochy, S., R. Medina, W. Patzert (2007): Recent climate variability in California: Spatial and temporal variations in temperature trends, Climate Research CR 33:159–169. The trio seem to be unaware of UHI - in fact in their paper they say (thanks, CO2 Science)
"the small increases seen in rural stations can be an estimate of this general warming pattern over land," which implies that "larger increases," such as those found in areas of intensive urbanization, "must then be due to local or regional surface changes."
However, the thrust of this post is not directed at Medina et.al., but at the original NASA/JPL author of the article, for below my last quote from that is this graphic:

In Los Angeles, average annual temperatures have increased steadily over the past 130 years. Image credit: NASA/JPL/Cal State L.A.
Notice "increased steadily over the past 130 years". The author clearly is looking at the chart with the eyes of a "True Believer". He appears to be looking at the red trend line, not the (unsteady) blue running average, not the fact that temperatures after the 1997 peak dropped to lower than the late 1960s/early 1970s. The blue running average shows that clearly. The nearest I can get to that chart is this one from GISS, but it's very similar, except for the missing early 80s peaks.

Los Angeles annual temperatures 1881-2011 GHCN via GISS

The red running mean has dropped to the 1955/6 level, similar to that for 1976. Of course, if I were a "True Believer" I'd just not see that. Perhaps "True Believers" look at temperature graphs with a right tilt to the head, which always produces a "steady increase", and snowfall graphs with a tilt to the left, which produces a vague childhood memory of what snow looked like.

Sunday, 29 January 2012

Warming Winters? Meteorologist Paul Douglas' disconnect with reality.

The Minneapolis Star Tribune warns "Warmer winters bring tick-infested springs"
In Minnesota, black-legged ticks have expanded their territory since 2007. More people live in wooded areas where ticks thrive, more mice and other rodents that carry Lyme disease survive warmer winters, and more ticks "hitchhike" on birds and humans.
Then follows some statistics about tick-borne disease (including the nasty "Lyme disease"), and the increasing prevalence of ticks in Minnesota, which I don't dispute. However, at the end we get a (second) quote from meteorologist Paul Douglas:
Winters in Minnesota have grown milder since 1998, Douglas said, with a steep reduction in Arctic air that was common even 20 or 30 years ago. "It's a slow-motion evolution," he said.
That "grown milder since 1998" is precise and checkable so let's do it, starting with NOAA's National Climatic Data Center's data for Minnesota:

NCDC Winter temperatures for Minnesota, 1990-2011

Apart from a downward tick for 2001, average winter temperatures have declined since 1998 (the peak). There's even a statistical downward trend since 1990. Focus in on Minneapolis-St.Paul, 1998-2011:
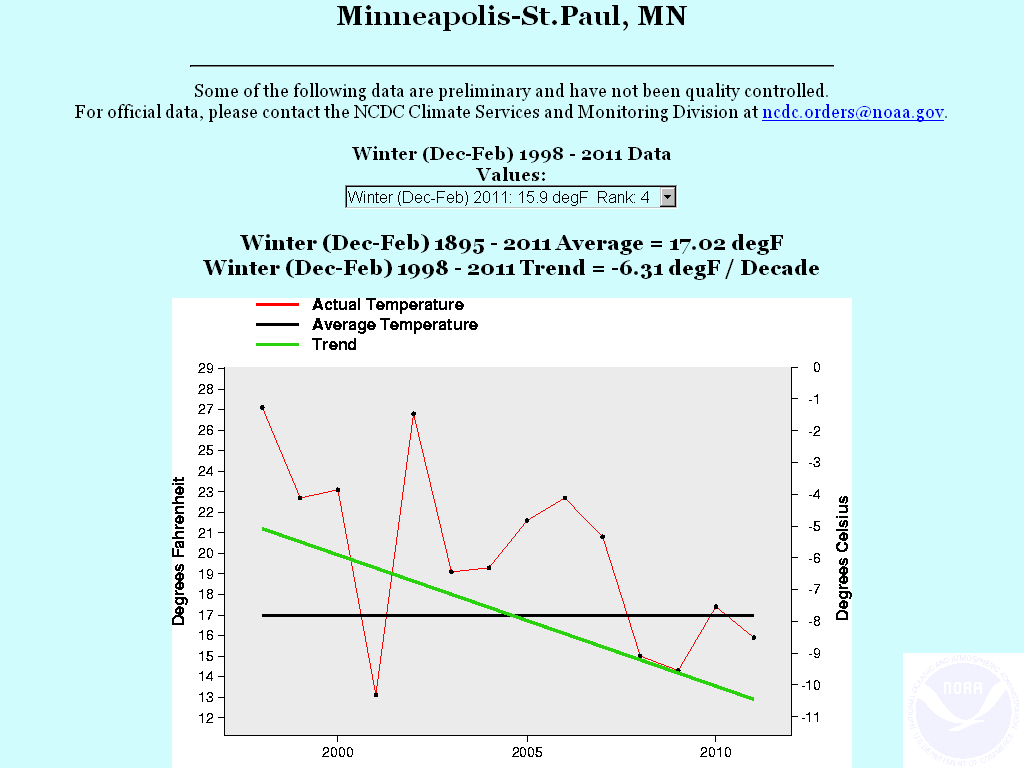
NCDC Winter Temperatures for Minneapolis-St.Paul 1998-2011

Other cities and towns in Minnesota show a similar trend from 1990, with pronounced cooling since 1998. The NCDC chart shows a downward trend of -0.88°F (-0.49°C) per decade, a whopping 8.8°F (-4.9°C) per century, the Minneapolis-St.Paul data an almost incredible 63.1°F (35°C) per century.

Where has Mr. Douglas been the last two decades, particularly since 1998? More to the point, where does he get his data to support his comment? Who is this Paul Douglas? Wikipedia knows - it seems he's an (ex-) TV weatherman, columnist and blogger. The Wiki page soon reveals something rather relevant :
Douglas regularly writes and speaks about global warming and is critical of those who say that it is not occurring or is not caused by human actions.
I write about global warming and I'm critical of those who say that something is occurring (warmer winters in Minnesota) when it's not. Mr. Douglas thinks Global Warming "deniers" are "immoral" ("Paul Douglas: 'I'm a recovering Republican, and I don't recognize my party any more"). I think those who tell the opposite of the truth are immoral.

As for Mr. Douglas' "steep reduction in Arctic air that was common even 20 or 30 years ago", have a look at "Arctic warming, increasing snow cover and widespread boreal winter cooling":

Abstract
The most up to date consensus from global climate models predicts warming in the Northern Hemisphere (NH) high latitudes to middle latitudes during boreal winter. However, recent trends in observed NH winter surface temperatures diverge from these projections. For the last two decades, large-scale cooling trends have existed instead across large stretches of eastern North America and northern Eurasia. We argue that this unforeseen trend is probably not due to internal variability alone. Instead, evidence suggests that summer and autumn warming trends are concurrent with increases in high-latitude moisture and an increase in Eurasian snow cover, which dynamically induces large-scale wintertime cooling. Understanding this counterintuitive response to radiative warming of the climate system has the potential for improving climate predictions at seasonal and longer timescales.
"For the last two decades" - I nearly ran out of fingers, but I'm pretty sure Mr. Douglas' 1998 is in there somewhere. Who's the "denier" now?

UPDATE 30th Jan. 2012

The Hufffington Post (such a goldmine of unbiased opinion!) says "On Climate Change, Weathercasters May Be Misguiding Their Viewers"
"If you look at the stats over the past five or six years, the public's belief that global warming is a serious problem, or is even happening, is declining," said Daniel Souweine, co-founder of the nonprofit Citizen Engagement Lab. In fact, nearly 40 percent of Americans are not convinced that the earth is heating up, according to the latest Pew Research Center poll.
"We think that's a result of the fact that they're not getting the right kind of information about what the science says," Souweine told The Huffington Post.
We've proof that one, in particular, isn't giving the "right kind of information", as I've shown graphically.

UPDATE 6th Feb. 2011

I found I'd used a GISS dataset for an entirely different Minneapolis for my original chart (should've spotted  the different lat/lon - silly me!), so to save time sorting THAT out I've substituted the NCDC plot for Minneapolis-St.Paul for the relevant 1998-2011 period.I've altered the text to suit - If anything it reinforces my point.

UPDATE 12th Feb. 2011

On his his Star Tribune blog is a "Send Paul a question" link, so I've done just that, and here it is:
A few weeks ago, you were quoted in a Star Tribune article on ticks in Minnesota:
"Winters in Minnesota have grown milder since 1998, Douglas said, with a steep reduction in Arctic air that was common even 20 or 30 years ago. "It's a slow-motion evolution," he said."
http://www.startribune.com/local/east/137802778.html
I'm interested in temperature trends, and often use the NCDC "Climate At A Glance" page to check trends for the US. However, using the form for Minnesota http://www.ncdc.noaa.gov/oa/climate/research/cag3/mn.html to plot winter temps since 1998 shows them to have been declining. I wonder if you could point me to a source that shows the opposite?
I'll let you know if I get a response.