Showing posts with label Global Sea-level. Show all posts

Saturday, 22 June 2013

Where Have all the Real Scientsts gone? Wise words from John A. Knauss

Who on earth is John A. Knauss? He was an oceanographer and was NOAA administrator between 1989 and 1993. It was his foresight which ensured that the effects of the intense El Niño of 1997-8 were adequately measured and analysed.

He added a foreword to a book which I have, written by Bruce C. Douglas and others titled "Sea Level Rise: History and Consequences", published in 2001. Its 270-odd pages are well worth a read if you're interested in a comprehensive and detailed analysis of the mechanics of the tides, and measurement of them. I'll try and find a download link and insert it here. I'll reproduce his foreword without comment apart from saying that he strongly emphasises the problem of uncertainty in understanding and quantifying the effects of the many factors which influence sea level measurement and prediction. One particular sentence of his stands out and is worth quoting right at the start.

Why is the volume of the oceans increasing? Do not expect to find an unambiguous answer in this book.
... and this:
We now believe that the ocean volume has been increasing since the middle of the 19th century at a rate equivalent to raising sea level almost 2 mm/yr, a rate considerably faster than that for the previous thousand years, although how much faster is subject to some uncertainty. That this increase in the rate of sea level rise began well before the rise in our mean atmospheric temperature of recent years gives pause to those who wish to assign its cause to anthropogenic-driven global warming.
I'll repeat my title question - where have all the real scientists (including him) gone?

Foreword to "Sea Level Rise: History and Consequences"

This book describes both clearly and in detail the complexity behind the deceptively simple subject of sea level rise, a topic of considerable scientific interest and increasing economic importance. The concept of sea level rise is quite straightforward. Some 97% of all the water on Earth is now in the oceans; most of the rest is found in glaciers, much of it in Antarctica and Greenland. Some 20,000 years ago at the peak of the last ice age, much more water was in ice and the sea level was more than 100 meters lower than it is today. The glaciers began to melt, the oceans began to fill, and the shorelines were pushed back as the sea level rose. The process continues, and the results are obvious. Archaeologists don aqua-lungs and explore the ancient port of Alexandria. Closer to home and more recent in time, St. Clements island in the Potomac River was a heavily wooded 160 hectares when first occupied by Virginia colonists. Today, some 350 years later it is about 16 hectares and has little in the way of vegetation. Pictures of battered beach houses and hotels eroded by waves after a particularly vicious winter storm moves up the east coast of the United States are a regular feature of our television news.

In the early 1980s when the issue of global warming first grabbed the headlines, I was in Washington as head of the National Oceanic and Atmospheric Administration. One of NOAA's tasks is to predict the tides and maintain this nation's vast array of tide gauges. What effect, I was asked, will global warming have on the change in sea level? It was embarrassing to admit that we really could not say much more than is in the above paragraph. Yes, sea level has risen in the past; we assume it still is rising, but uncertainty remains about how fast it has been rising recently, and thus we are not in a very good position to estimate how fast it might rise in the future. As this volume attests, there continue to be a number of perplexing issues. There is still uncertainty in some areas, but we do know so much more, not just about the changing volume of the ocean, but about yearly and regional variations in sea level and the reasons for them. Even more exciting, the technology now available suggests that we will soon know very much more.

We now believe that the ocean volume has been increasing since the middle of the 19th century at a rate equivalent to raising sea level almost 2 mm/yr, a rate considerably faster than that for the previous thousand years, although how much faster is subject to some uncertainty. That this increase in the rate of sea level rise began well before the rise in our mean atmospheric temperature of recent years gives pause to those who wish to assign its cause to anthropogenic-driven global warming.

Tracking the changing volume of the waters of the ocean, as distinguished from measuring local sea level, is not a simple task. Many traps lie in wait for the unwary, and not long ago many who had examined the problem were skeptical that we would ever achieve useful quantitative information. It has not been easy. Do not expect to examine a half-dozen years of local tide gauge records and derive a useful value. First, at least a 50-year record is required, because there are year-to-year changes (some of which we under-stand, but a number of which we do not) which are likely to bias records that are much shorter. Second, and often more difficult to resolve, the land bordering the sea also moves up and down. In much of Scandinavia the local sea level is dropping because the land is rising (several millimeters a year in places), continuing to rebound from the heavy weight of the glaciers removed several thousand years ago. But isostatic adjustment in those areas formerly under the ice requires some form of viscoelastic compensation in those areas away from the former ice sheets. For example, even if there were no change in the volume of the oceans, we now believe that the sea level would be rising along the east coast of the United States at about 1.4 mm/yr because that is the rate the earth is sinking in this part of the world. As a consequence the actual rise of sea level in this region is nearly double that caused by the change in the ocean volume.

Why is the volume of the oceans increasing? Do not expect to find an unambiguous answer in this book. Perhaps it is the melting of the last of our major ice fields. That is certainly what many believe, but we do not have sufficient information about the volume of ice on either Greenland or Antarctica, let alone its rate of change, to give an unambiguous answer. Perhaps the ocean is getting slightly warmer. If it is, then seawater will expand, and the volume of the ocean will increase although its mass will remain unchanged. An increase of the average ocean temperature (top to bottom) of only a few hundredths of a degree per year is all that is required to raise the sea level a couple of millimeters per year, but we do not have the kind of historical ocean temperature records to either prove or disprove such a possibility.

There may be better data on why humankind's activities of the last half century should be driving sea level lower. We have a good record of the number of dams built in the last half century and the amount of water they control. These dams change the historical flow of water from land to rivers and on to the ocean, and one can make educated guesses whether this should either increase or decrease the rate at which water reaches the ocean. Apparently, the largest single effect is the loss of water from behind the dam which leaches out of the bottom and back into groundwater. This water never makes it to farmland, homes, or industry, nor does it evaporate, later to fall as rain. This water completely bypasses the ocean. A strong case can be made that the rate at which the volume of dammed water is increasing, and thus the rate at which this water is bypassing the usual cycle, is equivalent to a decrease in sea level of possibly many tenths of a millimeter per year.

The rate of change of sea level varies from year to year and place to place. Evidence of past El Niños can clearly be seen in the long-term tidal records of San Diego and San Francisco. Year-to-year changes in the intensity of the wind-driven circulation in the North Atlantic are captured in the yearly changes in mean sea level recorded by tide gauges along the U.S. east coast. With the significant increase in tide gauge accuracy, not the least of which is the removal of the earth movement problem with the availability of GPS, one can expect tide gauges to contribute to an ever-increasing array of geophysical problems.

And finally, if sea level continues to rise, if it is indeed rising at a more rapid rate now than it was a century ago, and if, as some suggest, that rate of rise will increase as a consequence of global warming, what effect will this rising sea level have on society? To those who live in the Ganges delta of Bangladesh, on coral atolls in the Pacific, or below sea level in The Netherlands, this subject holds special interest. One estimate has some 100 million of us living within one meter of sea level. I expect they will be among those most interested in the latest news on this subject.

John A. Knauss

Sunday, 10 February 2013

Nils-Axel Mörner - winner of the 2012 prize for science fiction

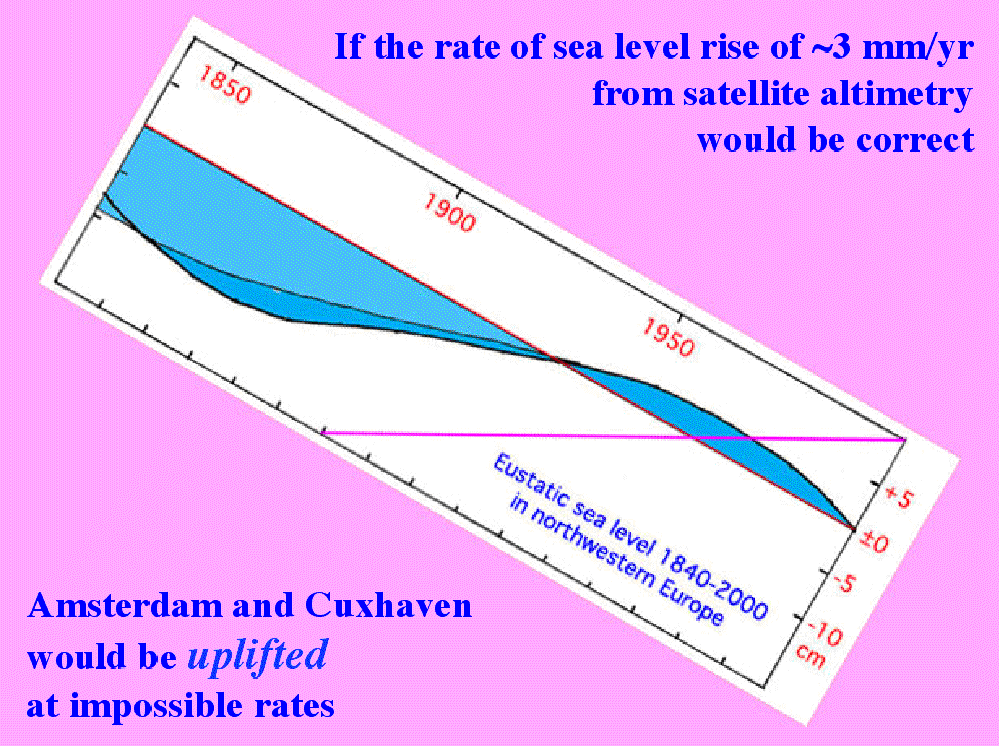
On 1st. December 2012, Nils-Axel Mörner showed the following slide (pdf at EIKE here) to attendees at a talk he gave (video here) during the seventh Heartland climate conference in Munich, entitled "Sea Level Rise - Fact and Fiction". Click to enlarge graphics.
Some of the "evidence" he produced, including this diagram, was fiction, and that which was not pure fiction was generally a misrepresentation of fact - not even the text on this slide is correct. He referred to it as "the current situation"; even those who are visually impaired can see it ends in 2000 - hardly "current" at the end of 2012. It's also a fiction because it doesn't include anything from Stockholm, as the text states, and as the following slide (below) shows; if it had it would be even more of a fiction, as Stockholm is pretty much in the middle of the Baltic, and far from the North Sea. It seems his geography is far from perfect, a failing he reveals elsewhere in his talk - a strange trait in a geologist.

"Amsterdam and Cuxhaven" - wot, no Stockholm?
I know that there were no satellites orbiting in 1840, apart from the moon of course. The satellite altimetry record started in October 1992, and applying a global rate to Cuxhaven is sleight of hand.

To be fair to Mörner, I think he allows himself to be totally seduced by his own views and controlled by his mindset, and so lacks objectivity. It's behaviour exhibited by conspiracy theorists, and Mörner demonstrates it clearly with his claims of "personal adjustments" of satellite altimetry. All adjustments are published on the 'net, and there are technical forums where they're discussed. The unadjusted data, and adjustment algorithms and relevant data are all available for public access. Does anyone really think that altimetry maps would be produced that could be easily refuted by data from a few tide gauges? From the many tide gauges that are in fact used to check their accuracy? Claims to have shown map inaccuracy invariably have a fatal flaw - they don't compare apples and apples; they don't compare identical periods from the maps and gauges. Comparing apples with apples is to compare the exact rate at the location with the gauge record over the exact same period. Those who seek to debunk the satellite maps are not just comparing apples with oranges, they're setting up a fruit market. More (much more) in a later post on this topic.

The "North Sea" slide may show the only sea-level "chart" you've seen that Mörner's produced himself. I've found no evidence whatever he's ever downloaded and charted a gauge dataset. It's clearly hand drawn, and the main curve is taken directly from his previous slide which represented Cuxhaven ("Coxhaven" on the slide), on the North Sea coast of Germany, the "German Bight".

Even this graphic contains a slight fiction - note the "2003" in the bottom RH corner; it's in a different font size, and there's no corresponding "tick mark" on the axis. That corner represents 2000, not 2003, as the distance to the previous tick mark shows, and the PSMSL annual chart for Cuxhaven confirms.
Cuxhaven 2 annual                                                                            Source:PSMSL
The 2000 tick mark at the top right is over what is the final broad spike on Mörner's graphic.

The red (subsidence rate) line is reproduced on the first slide as the zero line, which explains why it doesn't represent the mean, as is the convention with anomaly-type charts and diagrams. Both lines cross the polynomial curve at 1933, and this graphic shows that the curve diverges from the sea-level line after that point; it merely clips some of the spikes. Up to 1973 or so Mörner's plot matches the PSMSL plot very well; from then on it diverges suspiciously.

Cuxhaven annual (to 2010) adjusted down by 1.4 mm/year from 1844. Data source PSMSL
In "Sea Level is not rising" (SPPI), Mörner says he established the subsidence rate for the Cuxhaven gauge as 1.4 mm/year, so I've used it to adjust (downward) the annual plot for Cuxhaven. Published estimates for the subsidence rates along the Dutch and German coasts range from 0.6 to 0.9 mm/year. The chart is necessarily a little busy because I've added a polynomial curve (blue) to contrast with the curve in the first slide shown above; there's little similarity, and it's worth reproducing the diagram here for convenient comparison.
The text on the slide says "It fits the Earth's rotation (LOD) very well", but it doesn't represent any facts very well. Even if what is shown was true, it would say nothing of sea-level change elsewhere, not even in the North Sea. When land uplift or subsidence (from GPS monitoring stations) are taken into account, long-term North Sea sea-level change rates vary quite widely; some show an upturn in the last decade, some show a downturn, and some show no major variation in rate over the last few decades. Delfzijl is the next station to the west of Cuxhaven, and is just over the German border with Holland.

Delfzijl, Netherlands  Data source: PSMSL
It shows little similarity with the chart for Cuxhaven, shows little variation over the 20th century, and shows no slowdown after 1950.

Giving Mörner the benefit of the doubt, he's been seduced into believing that a polynomial curve supplied by someone else (see "Sea Level is not rising") reflects reality, and has based his sea-level "curve" on that. If he'd actually charted the record himself, with the most up-to-date data available, he couldn't have produced his curve. Data beats hypothesis hands down every time.

The previous slide to his "North Sea" curve (Cuxhaven curve, not quite the same thing) showed the PSMSL chart for Fremantle, Western Australia. Mörner never cites his sources for charts and diagrams and doesn't here; not a very polite nor ethical way of presenting such data.
Ignore that the title says 1897-2011 - it's 1897-2010. Ignore the "1893-2011" mean - Mörner's very bad with start and end dates, as we've seen earlier. Ignore his blatant "cherry-picking" of 1913-1956. Ignore that his "global eustasy" (absolute rise) was derived from just 2 1/2 gauge records in NW Europe (Amsterdam again!). Ignore that there's no source cited, he got it here, and I got the data for my Fremantle chart from the Australian BOM site.

This one's a real cracker though - Mörner commits what might be called evidential suicide. He's telling us that his absolute rate of 1.1 mm/year applies here, calculating a subsidence rate, then he's telling us that there was "little or no absolute sea level rise" which of course means that his rate of 1.1 mm/year doesn't apply here. It also shows no downturn after 2000. Nice one Prof.

I'll also tackle Mörner's famous (or infamous, depending on the point of view) Maldives paper later, which is flawed to the point of being worthless, but here's a taster from its third page (my bold)
The mean sea level seems closely to approximate the surface of a beach rock cut into a flat surface (a rock cut platform). The HTL is at + 0.45 m, the storm level at + 0.9–0.8 m, the sub-recent level is at + 1.2 m, and the old island surface at + 1.45 m. This seems to indicate that the island surface was built up at a 60 cm higher sea level and that the sub-recent level was formed at a 30 cm higher sea level.
A higher sea level of about + 60 cm in Late Holocene times is recorded in sandy environment (e.g. Hulhudhoo in the Baa Atoll) as well as in beach-rock environment (e.g. Fulhudhoo in the Guidhoo Atoll). The sub-recent level seems, in general, to have been at about + 30 cm (in sandy section of the Hulhodhoo as well as in the beach-rock coast of Fulhudhoo).
The most important and interesting fact is the sea level fall of about 20–30 cm between the sub-recent level and the present level. The morphology is clear.......
Beautiful logic chain here; seems.....seems....seems.....it's clear! I love that "seems closely to approximate" - how can something "closely approximate" something else? The language and logic "seems to closely approximate" that in IPCC AR4 "Summary for Policymakers", where a number of factors which are "likely" lead to a conclusion which is "very likely". How did he know what the "mean sea level" was, standing on a sandy beach with the waves lapping? All will be revealed in a later (but soon) post.

I'll also discuss his flawed methodology in general in a future post, along with examining more of his gaffes and sleight-of-hand. I thought (silly me!) that being sceptical meant demanding  "show me your evidence and your sources". Why has no-one on the sceptical side thought proper to actually examine his claimed evidence and his arguments in detail? Is he immune from such scrutiny? Is he to be believed no matter what he says? Is he infallible in some way, like the Pope? If the answer to any or all of these is yes, then his supporters are guilty of at best double standards and at worst religious adoration.

The audiences at his talks, and readers of his articles lap it all up. "Good old Prof" they chortle "He's sticking it to 'em!". "They" aren't impressed; "they" ignore and ridicule him alternately. He's sticking it to us, sceptics working to call into question shaky science and excoriate alarmists and alarmism. He's pissing into the wind trying to prove the unprovable, and it's sceptics in general getting the spray.

Tuesday, 8 January 2013

The Nodal Tidal Cycle and a firm belief in the impossible

I've not paid much attention to the prognostications of Prof. Nils-Axel Mörner in the past, but recently his claims concerning global sea-level have been featured on several blogs, most notably Jo Nova. Several things struck me while reading the latter post, so I downloaded his paper entitled, rather uncompromisingly "Sea level is not rising" to give it a once-over. I focus here on this section with an accompanying chart:
French Guyana and Surinam
From this region, there is a very good tide-gauge record covering three 18.6-year tidal cycles (Fig. 14). The cycles vary symmetrically around a stable, horizontal zero-level. Satellite altimetry gives a rise of 3 mm/year in the same area. Facts and fiction seem to clash.
Figure 14. Changes in mean high-water level (cm: left axis) measured by tide gauges at the coast of French Guyana and Surinam (Gratiot et al., 2008; Mörner, 2010b). The record is dominated by the 18.6-year tidal cycle, which swings up and down around a long-term zero trend (the arrowed line), indicating that sea level has been quite stable over the last 50 years. However, satellite altimetry in the same region gives a rise of 3.0 mm/year – another revealing example of the difference between recorded facts and “reprocessed” satellite data.
I'll ignore for the moment that the graphic doesn't represent a tide-gauge record, that it doesn't show mean sea-level (which is what's under discussion here) and that it doesn't cover three tidal cycles. Instead I'll look first at what Gratiot et al., 2008 actually says about the nodal tidal cycle (henceforth NTC) and its manifestations and effects, and whether it affects mean sea-level (MSL) at all. The paper "Signifcant contribution of the 18.6 year tidal cycle to regional coastal changes" can be found here - it concerns itself with the effects of MHWL or mean high water level on erosion and sedimentation along the north-west coast of South America.

MHWL or mean high water level is the average of high water level (maximum tidal height) over the period under consideration. MHWL is accompanied by MLWL, mean low water level, and mean sea level is approximately half way between. The main conclusions of Gratiot et al. aren't disputed here; it seems perfectly logical that higher tidal levels cause greater shoreline erosion and that the nodal tidal cycle, which amplifies and reduces MHWL over an 18.6-year cycle has a significant effect. However, the last paragraph of the paper introduces another topic entirely; a claimed link between the NTC and mean sea level.

What I find amusing is that it isn't even necessary to understand the NTC. what causes the NTC to amplify tidal cycles worldwide, or even the extent of that amplification, to use the accompanying chart in Gratiot et al. to disprove their supplementary (and alarming) claim. However a brief description of the NTC might make things a little clearer. The Moon's orbit is inclined relative to the Earth's orbit around the Sun, which means that the Moon and the Sun pull on the oceans at a slight angle to one another. The lunar nodes are the points where the Moon's orbit crosses the plane of the Earth's orbit. When the Moon is at one of these nodes the Moon and Sun exert their pulls along the plane of Earth's orbit, and the total is greater than at other times. High water is at its highest during that part of the 18.61-year cycle, low water is at its lowest. 9.3 years either side, the effect is opposite, high water is reduced, low water increased. Back to Gratiot et al.
This study confrms the hypothesis that low tidal constituents are a major controlling factor in the evolution of the very gently sloping muddy coastal plain and shoreface of the Guyanas. Although tides have no effect on the long-term sea-level trend, they induce important fluctuations of the MHWL, when considering decadal timescales. As this timescale is particularly important for shoreline management and for policy makers, it is crucial to highlight the shoreline fluctuations associated with the 18.6 year cycle. From now to 2015, the coast of the Guyanas is expected to retreat by about 150m, 60% of this retreat resulting from the effect of the low-frequency tide constituents and 40% from sea-level rise due to global change. The nodal tidal cycle has a predictable effect on the tidal amplitude everywhere. It modulates the tidal amplitude by about 3% so that regions experiencing macro-tidal regimes are particularly concerned. Over the next decade, many coastal areas in Australia, Canada, China, England and France will experience a sea-level rise of several tens of centimetres due to the 18.6 tidal cycle (Fig. 3). This rise will contribute significantly to coastal erosion generated by global sea-level rise.
After having said that "tides have no effect on the long-term sea-level trend", they then say that "many coastal areas in Australia, Canada, China, England and France will experience a sea-level rise of several tens of centimetres due to the 18.6 tidal cycle". They mean of course that the mean sea-level will rise due to the increase from the low phase of the cycle in 2006 (see the chart above) to a high point some 9 years later. Here is their Fig.3, though from the preprint version of the paper - in the published version the title has vanished.
Figure 3 Predicted shifting of the MHWL under the 18.6 year nodal cycle for the next decade. (Adapted from the global map of tidal amplitude proposed by ref. 29 by considering a modulation of signal of 3%.) Grey areas correspond to locations of decrease or negligible rise. The black box (48W-62W-2N-12N) delimits the mud bank system of the Guyanas, South America.
Ref. 29 is Simon, B. La Marée Océanique Côtière (Institut Océanographique, Paris, 2007) if anyone's inclined to follow it up. Babel Fish translates "La Marée Océanique Côtière" as "The coastal ocean tide" which makes sense, if not good grammar, whereas Google Translate mangles it into "Tide Ocean Resort", which has a distinctly commercial flavour to it.

Note however how "Predicted shifting of the MHWL" in the caption becomes "sea-level rise" in the text. Note also that the sign of the "sea-level rise" is always positive; the scale has no negative part. This chart therefore must represent global sea-level rise due to a modification of tidal cycles. It demands the question - where does the water come from to generate this global rise? A second question - where did the water go to generate the implied previous 9-year low? A third question - why do none of the areas claimed as most affected show any part of such a large rise since 2006, nor any similarly large dip of "several tens of centimetres" over the previous 9 years? Their original chart is presumably based on a version of this one

Source: Aviso
.... which shows the lunar component of the global tides.

Their first mistake is assuming that the effect of the NTC is to amplify the tidal range by 3% globally; it does not. Several papers show the effect to be around +-5cm in the English Channel and North Sea, rather than the +-18-30cm their chart shows. The effect along the US Atlantic coast is greater than their chart shows, and the effect along the SW coast of Australia is also greater than their 3%, which I assume they calculated for their area of study, French Guyana and Surinam.

Their second mistake is a simple statistical one; if a range broadens, the difference between the mean of the range and the new maximum increases by only half the broadening. A range of 10-20 has a mean of 15, broadening to 10-30 increases the mean to 15. A range of 10-20 which broadens about its centre, the mean, produces no change in the mean at all. So even if the NTC produces an increase in the MHWL of 10cm, the mean can't increase by any more than 5cm. Even if they are correct in their assumption that an increase in MHWL produces a change in MSL, the latter can't possibly be equal to the former. In fact, tidal cycles expand and contract about their centre as I will show in detail in a later post, and as the NTC produces a simple broadening and shrinking of those cycles, it can't possibly cause any measurable change in MSL. I intend to write to the journal editors on the topic of the logical fallacies in the last paragraph in Gratiot et al., 2008.

A little background information here - It was this very topic, the Nodal Tidal Cycle, which got me interested in studying sea-level change several years ago. Having read of the claimed effect on local MSL, I decided to look for evidence in tide-gauge records. If the effect was as large as claimed, the effects should be obvious. I didn't expect to find that all sites would show it; I'd have been satisfied with a few clear examples. In short, I found none. I did find a few articles where the gauge record appeared to show some correlation for just a part of the record. Adjacent gauge sites I checked didn't show the effect at all, a fact curiously omitted by the authors. I even found a couple of published papers claiming to have found the effect. Their statistical "proof" was, to be candid, laughable. Most authors who refer to and study the effect of the NTC on MHWL, and its effect on erosion or some other phenomenon don't in general mention MSL; if they do, they don't link it with the NTC. Here's the abstract for one paper which does;
Nodal Tidal Cycle of 18.6 Yr.: Its Importance in Sea-Level Curves of the East Coast of the United States and Its Value in Explaining Long-Term Sea-Level Changes
Clifford A. Kaye and Gary W. Stuckey
The 18.6-yr cycle of the Moon's nodes dominates the annual means of high water, low water, and range at Boston and at other East Coast harbors. The maxima and minima of the high-water and range curves agree closely with the 180° and 0° long. yr, respectively, of the Moon's ascending node, and are fairly well accounted for by tide-prediction equations. The curve of annual mean sea level also reflects the cycle, but more weakly. Recognition of the cyclical nature of tidal data both simplifies and clarifies assessments of longer term sea-level trends and points to the need to include only multiples of entire cycles in the computations of these trends. When the curves of mean high water and range are used, it is possible to recognize long-term sea-level trends rapidly and to determine whether these are attributable to tidal or nontidal causes. The data suggest that the secular sea-level rise during the 20th century is tidal in origin and may be caused by vertical movement of the oceanic floor. This has the effect of reducing the volume of ocean basins, and, by changing basin geometry, alters the characteristics of terrestrial tidal constituents (standing waves).
Now I'd say that if the "secular sea-level rise during the 20th century" was caused by "vertical movement of the oceanic floor", then it's clearly not "tidal in origin". They also say that "The curve of annual mean sea level also reflects the cycle, but more weakly", while providing no proof in the text but for Boston, just one of the many sites they analysed. I'll be covering their assessment in a later post.

The realisation that the NTC simply amplified tidal cycles and didn't shift their mid-points soon dawned on me. Put simply, if high water increase due an effect on the gravitational pull of the moon, that water has to come from somewhere. The "somewhere" is in fact two "somewheres", the areas at right angles to the Earth-Moon axis along which the Moon exerts its pull. Those areas see lower tides as a result, and as the Earth rotates though the "tidal bulge" the point experiencing the higher tide experiences the lower tide some 6 hours later. The Gratiot et al. paper hasn't got a "somewhere" to act as a source for their claimed increases, ergo those worldwide increases can't happen, and Mörner's link between MHWL and sea-level is spurious.

I haven't actually provided any actual proof - you know graphs and stuff, that what I claim about the non-effect of the NTC on local mean sea-level is correct. That's for a later post, already in preparation. In the meanwhile, I'll return to my comment on Mörner's reproduced chart. The source is Fig. 1c in the Gratiot et al. paper (my bold in the caption)

c, Nodal cycles of the mhwl in Surinam and French Guiana. From 1958 to 1978, tidal gauge measurements in the mouth of the Surinam river ; from 1979 to the present, data from the tidal model of the Service Hydrographique et Océanographique de la Marine (SHOM, France www.shom.fr/ann_marees) obtained from tidal gauge measurements on Devil’s Islands (French Guiana). The corresponding phases of overall erosion and colonization reported by previous studies and in this work are shown as red and green patches. 
As I said, It's not a tide-gauge record and it doesn't show MSL but MHWL. I've never seen a tide-gauge record which looks like that, with a smooth multi-year cycle - no-one has. I'll overlook the fact that it's stitched-together from two sources. I'll even overlook that it doesn't cover "three 18.6-year tidal cycles". What I can't overlook is misrepresentation. Perhaps we sceptics should be more sceptical of what's claimed as proof - from "friends" as well as the "other side".